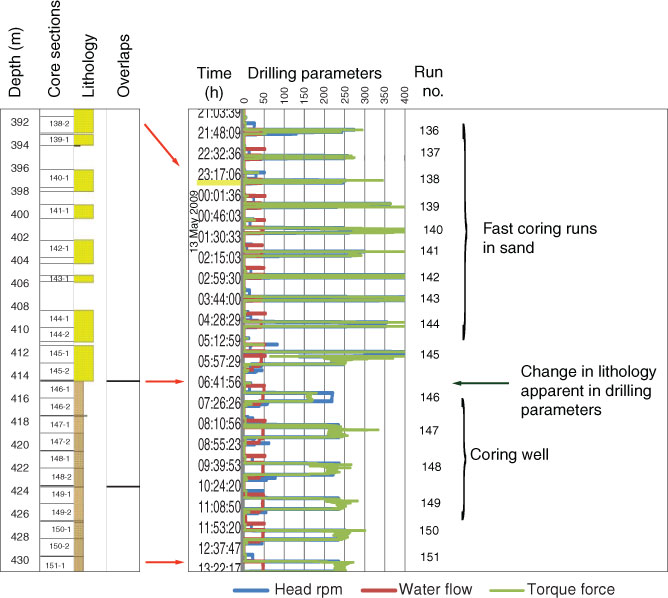
Figure F2. Coring runs in the expanding clay interval, Hole M0027A. See Figure F4 in the “Methods” chapter (Expedition 313 Scientists, 2010a) for lithology pattern definitions. Red arrows = correlation between depth (CSF-A) and time. Refer to Figure F1 for location within the borehole.
Previous | Close | Next | Top of page