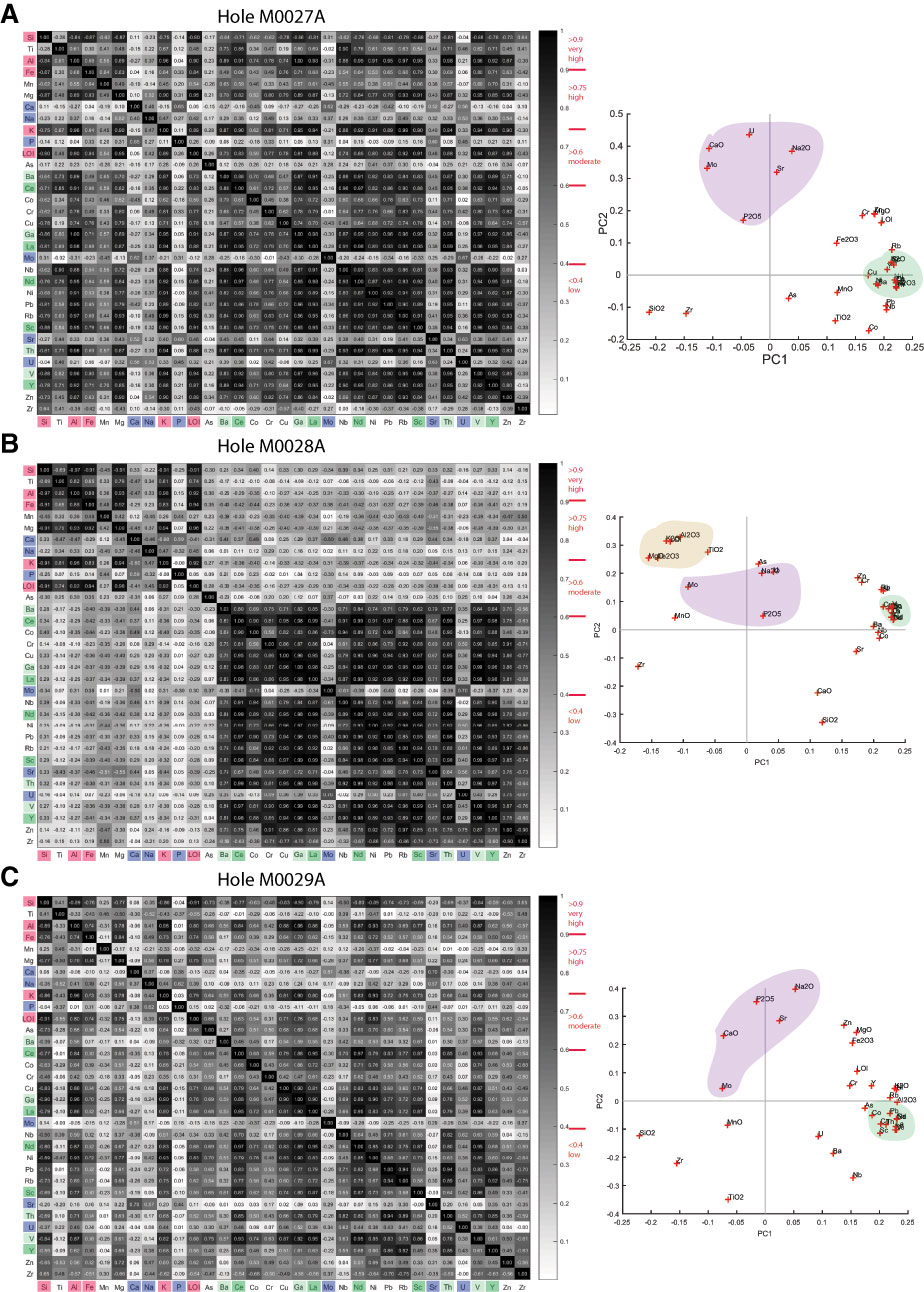
Figure F2. Statistical analyses for X-ray fluorescence (XRF)-sample data for Holes (A) M0027A, (B) M0028A, and (C) M0029A as (left) correlation plots and (right) principal component analysis (PCA) plots of the first two principal components. Correlation plots: major element oxides are listed without the oxide; green = REEs, red = elements with a high covarying correlations, pale green = elements with moderate to high correlations, blue = elements and oxides with lower correlations. PCA plots: purple shading = second principal component (PC2) element grouping, green shading = rare earth elements (REEs), brown shading = element grouping in clay. Statistical results can be seen at larger scale in “Appendix D,” along with numerical values for the PCA analyses.
Previous | Close | Next | Top of page