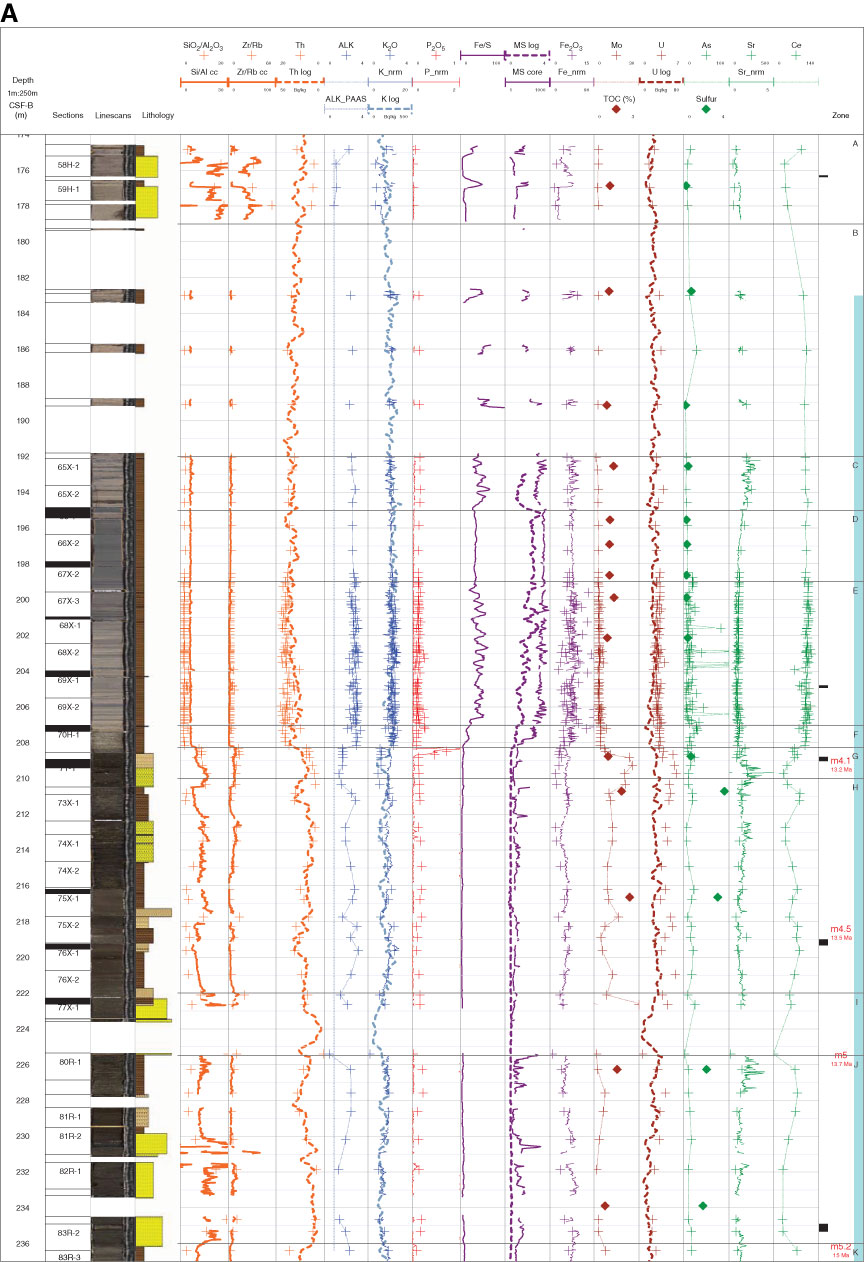
Figure F3. Selected X-ray fluorescence (XRF) major oxides and trace element data, key element ratios, and physical property logs for Holes (A) M0027A, (B) M0028A, and (C) M0029A. All measured data are shown as scaled depths (core depth below seafloor, Method B [CSF-B]) with logs depth-matched to a reference log (wireline matched depth below seafloor [WMSF]). Only core numbers are given for Hole M0029A because of the smaller scale of the plot). Black shading in section/core = overlapping intervals (excluding core catcher sections) where caution needs to be applied to the analysis of associated samples. Lithology is from the “Expedition 313 summary” chapter (Expedition 313 Scientists, 2010a). + = XRF-sample data that are extrapolated by a dotted line where data from the split core surface are not available (these lines are shown as a visual guide only as where sampling intervals are lower there are large gaps between samples). Split core data have been normalized to total counts (suffixed by “_nrm”) unless a ratio is used where, as measurements were taken every 1 cm, these have been averaged and shown as a continuous line (suffixed by “_cc”). Downhole logs are shown as a heavier dashed line. Consistent scales are used across all sites, with the exception of the downhole magnetic susceptibility log in Hole M0027A where a larger maximum value was required to capture the variation. The right column of each plot indicates the location of sequence boundaries (Miller et al., 2013) and their ages, as per the base of the overlying sequence (Browning et al., 2013). Note that for seismic reflector m4.1 in Holes M0027A and M0028A the ages reflect the top of the underlying sequence (Browning et al., 2013). The location of indurated sediments (black), pore water salinity (fresh = blue, saline = yellow) are indicated after the “Expedition 313 summary” chapter (Expedition 313 Scientists, 2010a). The geochemical and physical property data are color-coded as below in the plots for all holes, from left to right: Orange (3 tracks): Si/Al and Zr/Rb ratios and Th. Note that Th has reverse scale for easier comparison with the ratios. Blue (2 tracks): Track 1 shows total alkali [(Na2O + K2O)/K2O] and the PAAS total alkali for comparison (Taylor and McClennan, 1985). K is plotted in Track 2. Red (1 track) = P. Purple (2 tracks) = Fe/S ratio (core and log magnetic susceptibility and total Fe also shown). Note that for Hole M0029A intervals of high electrical resistivity are included (black bars) to show where the core magnetic susceptibility must be interpreted with caution due to repeated instances of metal core catcher fragments within the core. Brown (2 tracks) = Mo and U with core TOC measurements. Green (3 tracks) = As, Sr, and Ce with core total sulfur measurements. (Continued on next two pages.)
Previous | Close | Next | Top of page