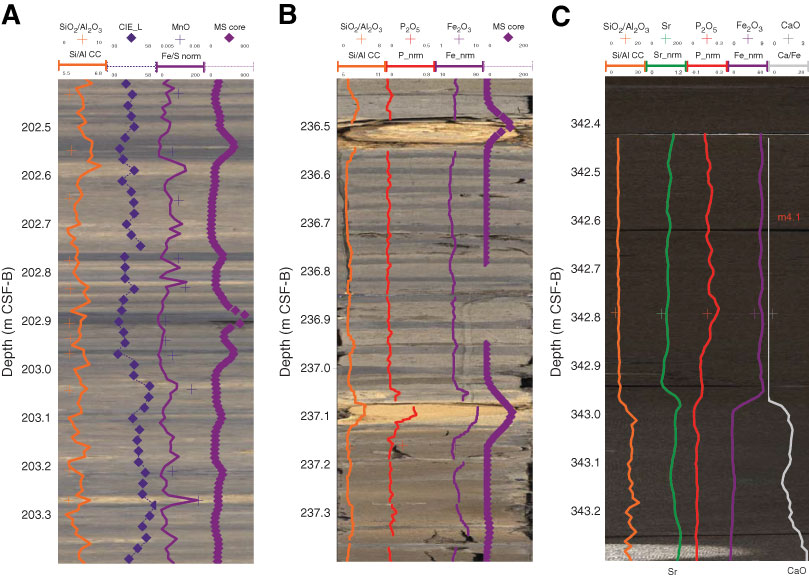
Figure F4. A. Banded clay interval with high magnetic susceptibility (Section 313-M0027A-68R-2; 202.4–203.4 m CSF-B). Darker bands have high magnetic susceptibility and low Fe. Si/Al ratios show no discernible pattern, suggesting little difference in grain size despite increasing the scale from Figure F2A. B. Section M0028A-6R-2 (236.4–237.4 m CSF-B). This interval is in the clays above the interval of higher magnetic susceptibility and illustrates the increase in magnetic susceptibility and Fe over a nodule. Si/Al ratios also increase, although note the change of scale from Figure F2B. C. Section M0029A-71R-2 (242.4–243.4 m CSF-B). This interval is an apparently homogeneous clay until a change to siltier lithology at 342.9 m CSF-B. The seismic reflector m4.1 surface was originally interpreted to fall within this interval (see the “Expedition 313 summary” chapter [Expedition 313 Scientists, 2010a]), but was shifted downhole postexpedition (Miller et al., 2013).
Previous | Close | Top of page