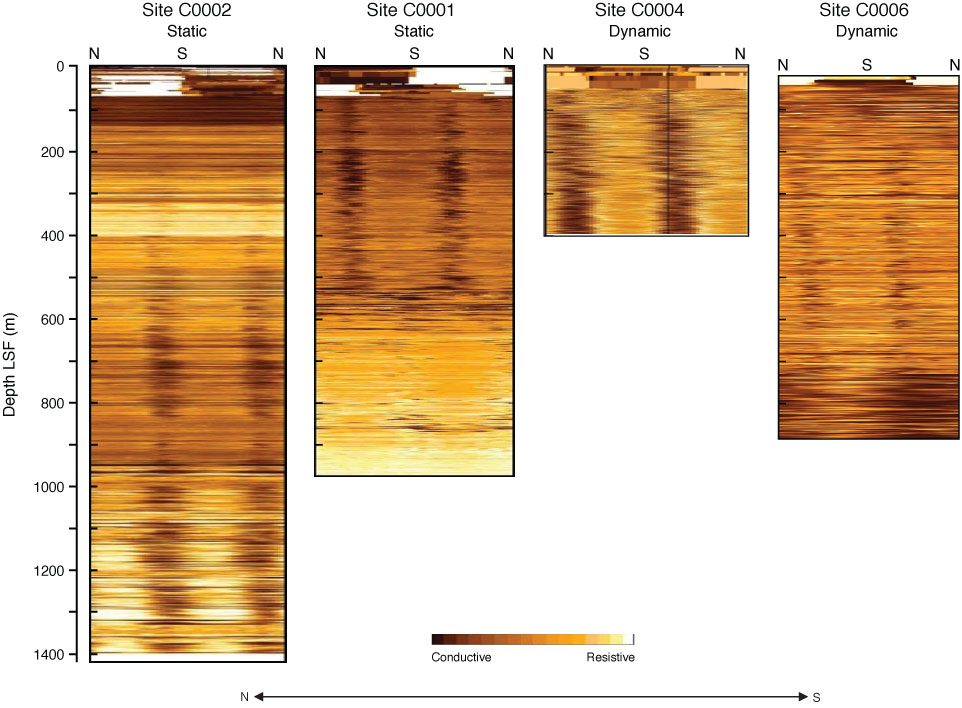
Figure F8. Resistivity-at-the-bit images synoptically showing full depth extent of LWD intervals, Sites C0001, C0002, C0004, and C0006. Vertical paired dark bands are images of borehole breakouts that have been interpreted in order to generate the average SHmax azimuths shown in Figure F9. LSF = LWD depth below seafloor.
Previous | Close | Next | Top of page