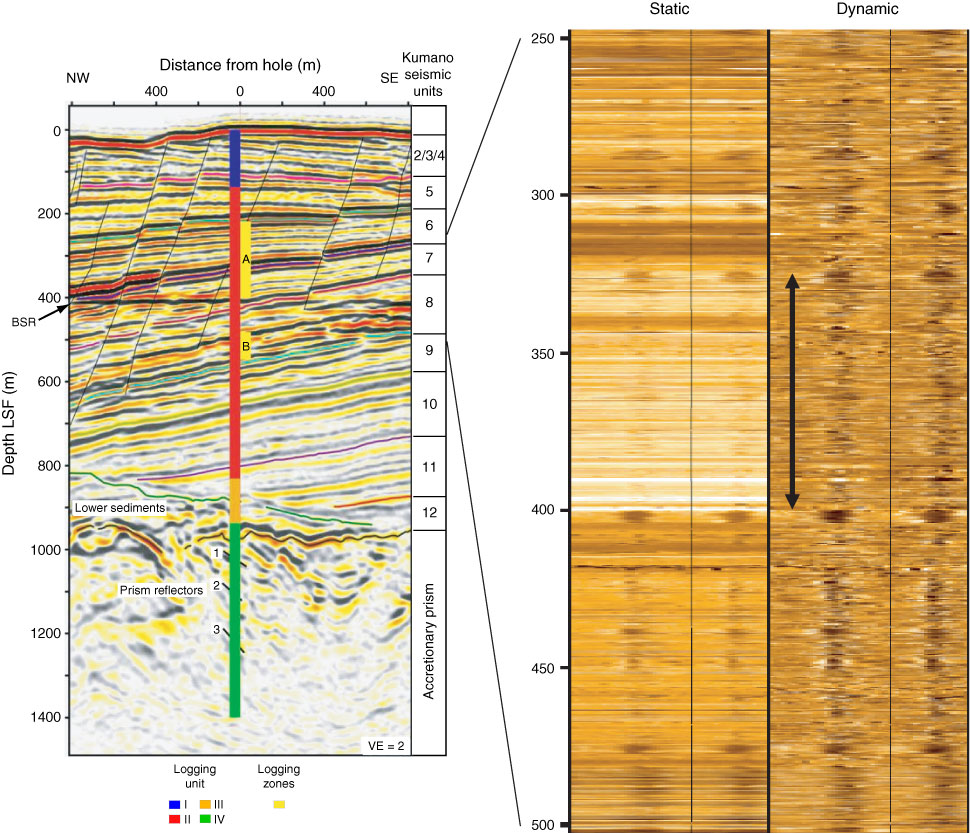
Figure F24. Gas hydrate zone at ~250–400 mbsf at Site C0002 based on high-resistivity image (right panel), low gamma ray values, and high P-wave velocity log. Base of gas hydrate zone (400 m LSF) matches the bottom-simulating reflector (BSR) identified by the three-dimensional seismic data (left panel). LSF = LWD depth below seafloor, VE = vertical exaggeration.

Previous | Close | Top of page