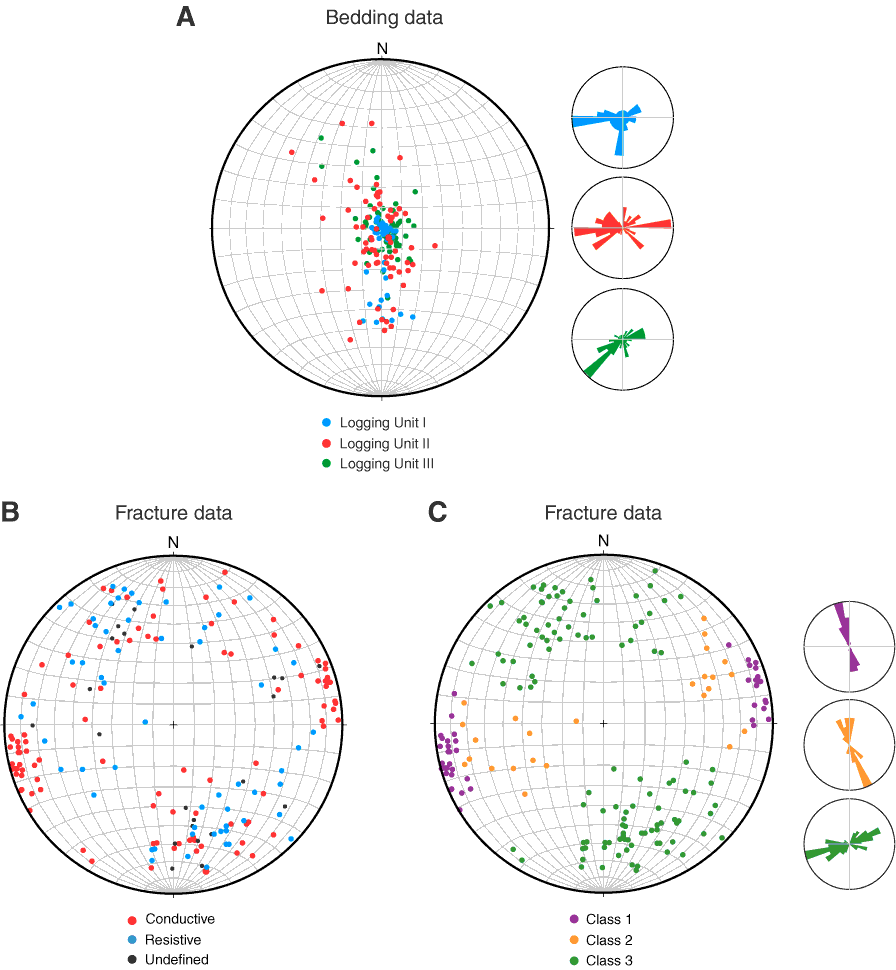
Figure F40. Equal-area lower hemisphere stereographic projection of (A) poles to bedding dips and (B, C) poles to fractures. Fracture poles are represented according to (B) resistivity and (C) fracture azimuth and dip divided into three classes. Class 1 pole trend = 040°–110° and 220°–290° (northwest–southeast trending planes), dip > 75°; Class 2 pole trend = 040°–110° and 220°–290° (northwest–southeast trending planes), dip < 75°; Class 3 pole trend = 110°–220° and 290°–040° (northeast–southwest trending planes), all dips. These divisions of azimuth represent natural breaks in the data. Rose diagrams represent fracture azimuths shown as dip direction – 90°.
Previous | Close | Next | Top of page