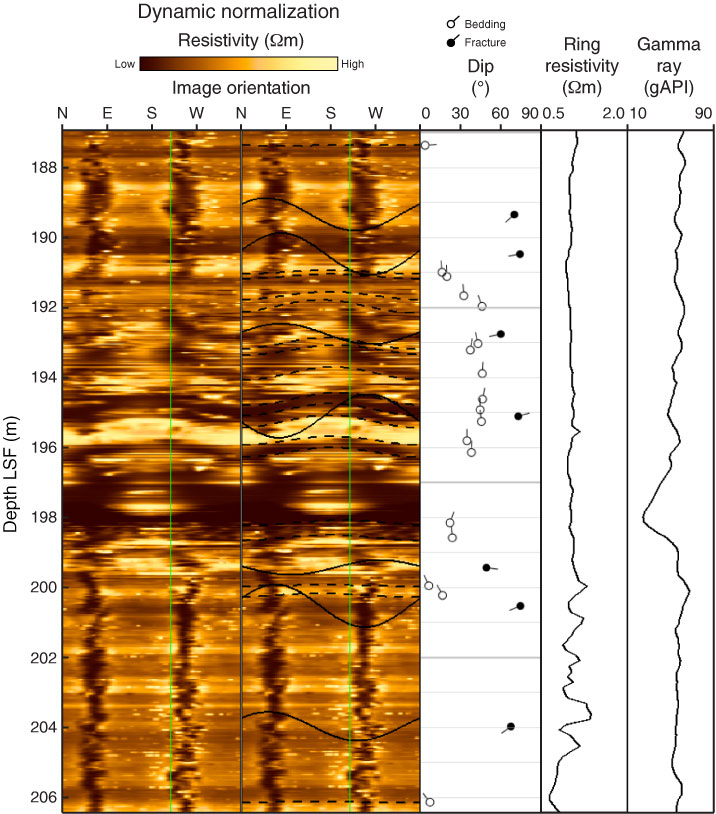
Figure F41. Close-up of resistivity image across logging Unit I/II boundary (187–207 m LWD depth below seafloor [LSF]). Subunit IB shows a systematic change and increase in bedding dip, whereas beds in Subunit IA and in the shallow part of Unit II are subhorizontal. Tadpole lines = dip direction of plane.
Previous | Close | Next | Top of page