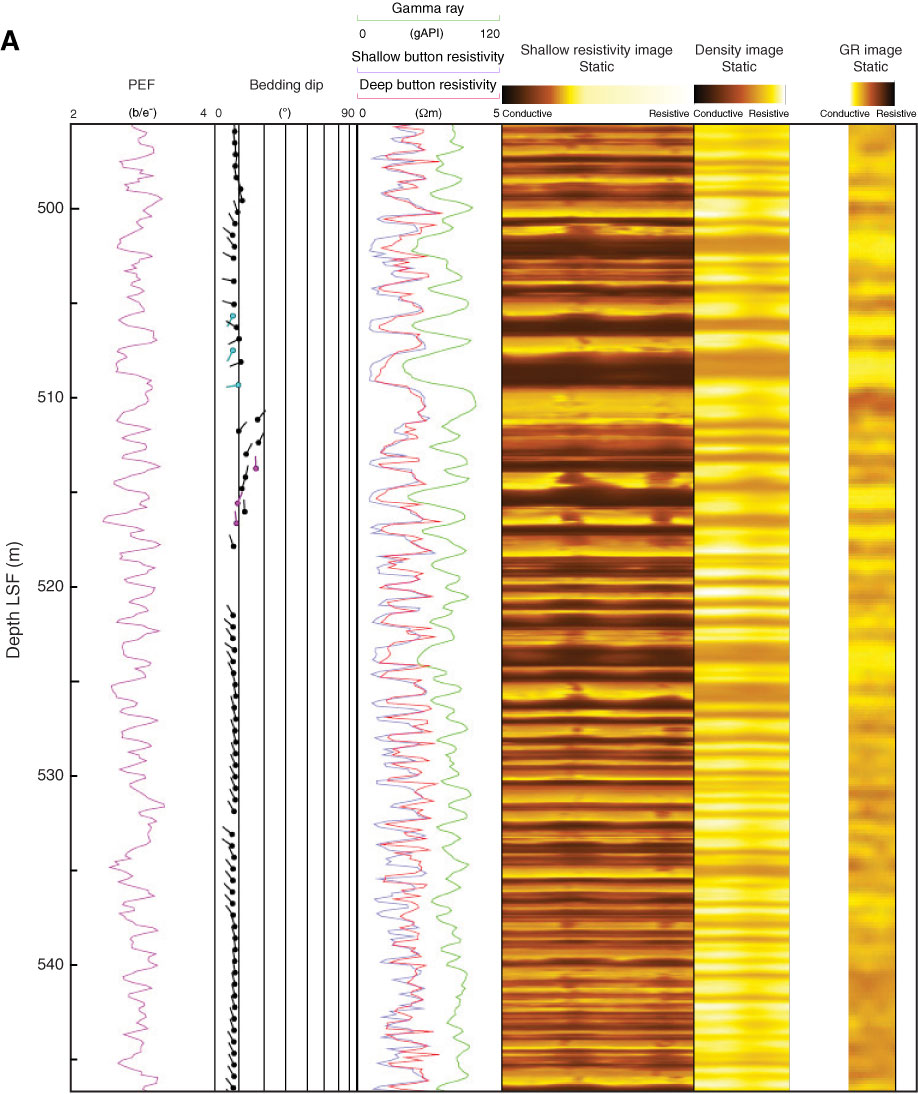
Figure F12. A. Representative images of facies variability corresponding to boxed intervals in Figure F11. Typical resistivity image of logging Unit II Zone B. Layered sediments are identified as alternating resistive and conductive layers in the image. A thickening upward trend is displayed within this section. Light bands are also observed on the density image and the natural gamma ray (GR) image. Higher frequency excursions are indicative of thinner layers toward the bottom. Dip measurements indicate generally north-northwest to northwest bedding dips. LSF = LWD depth below seafloor, PEF = photoelectric factor. (Continued on next page.)
Previous | Close | Next | Top of page