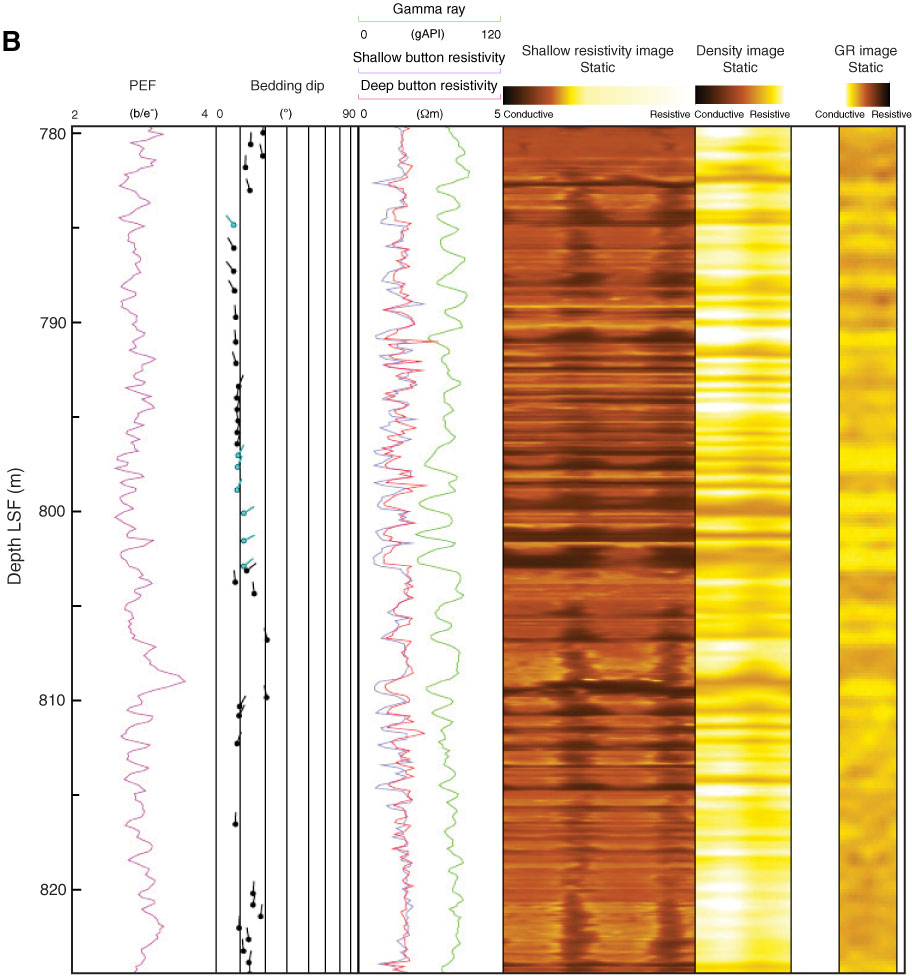
Figure F12 (continued). B. Resistivity images from the basal part of logging Unit II showing high-frequency alternating cycles composed of resistive and conductive layers. Notice a predominance of darker colors indicating lower resistivity than in Zone B. Dip measurements indicate north-northwest to northwest bedding dips. LSF = LWD depth below seafloor, PEF = photoelectric factor GR = natural gamma ray.
Previous | Close | Next | Top of page