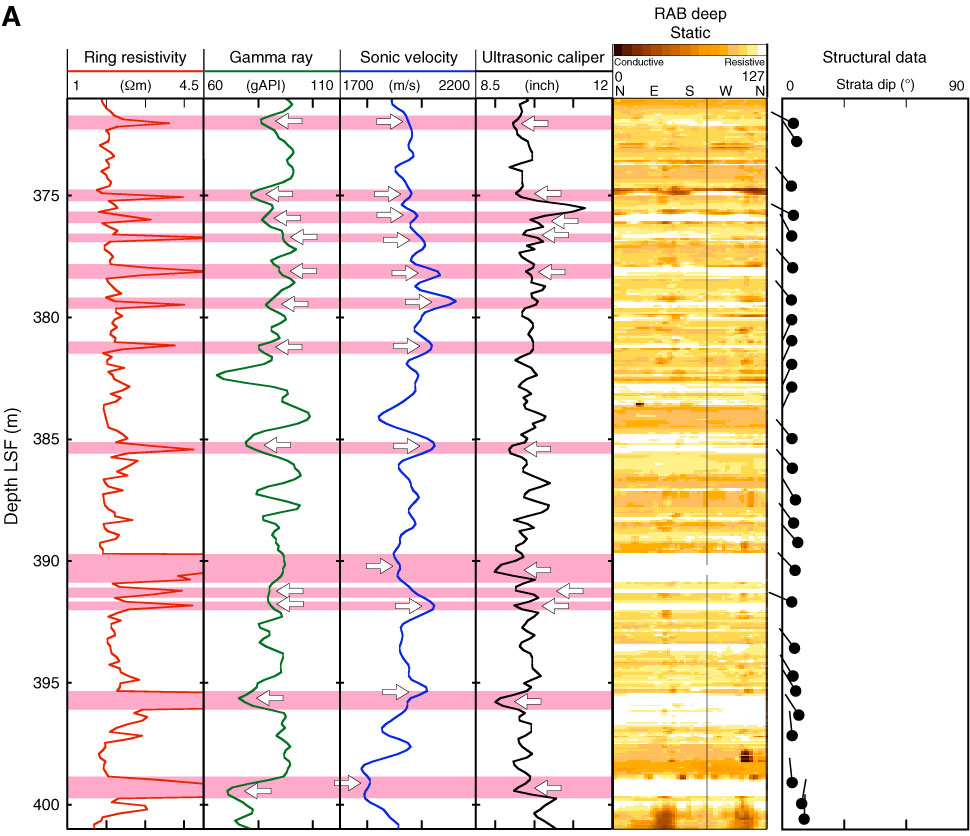
Figure F13. A. Ring resistivity, gamma ray, sonic velocity, and ultrasonic caliper logs and a resistivity-at-the-bit (RAB) deep image in the interval 371–401 m LSF, the lowermost part of Zone A. Arrows indicate that all resistive peaks (colored zones) are correlated to lower gamma ray and higher velocity peaks and intervals of larger borehole diameter. Dip measurements indicate north-northwest to northwest bedding dips. (Continued on next page.)
Previous | Close | Next | Top of page