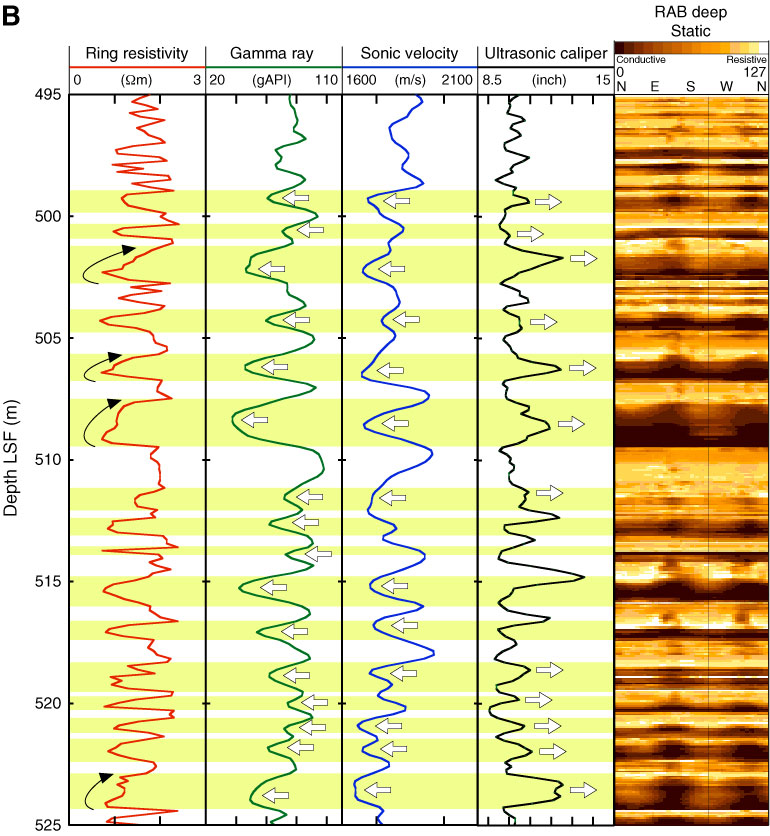
Figure F13 (continued). B. Ring resistivity, gamma ray, sonic velocity, and ultrasonic caliper logs and resistivity-at-the-bit (RAB) deep image in the central part of Zone B (495–525 m LSF). Arrows indicate that conductive layers (colored zones) are correlated to lower gamma ray and lower velocity peaks and intervals of smaller borehole diameter. Sharp lower boundaries and gradational tops are observed in each conductive layer from the ring resistivity log and RAB image.
Previous | Close | Next | Top of page