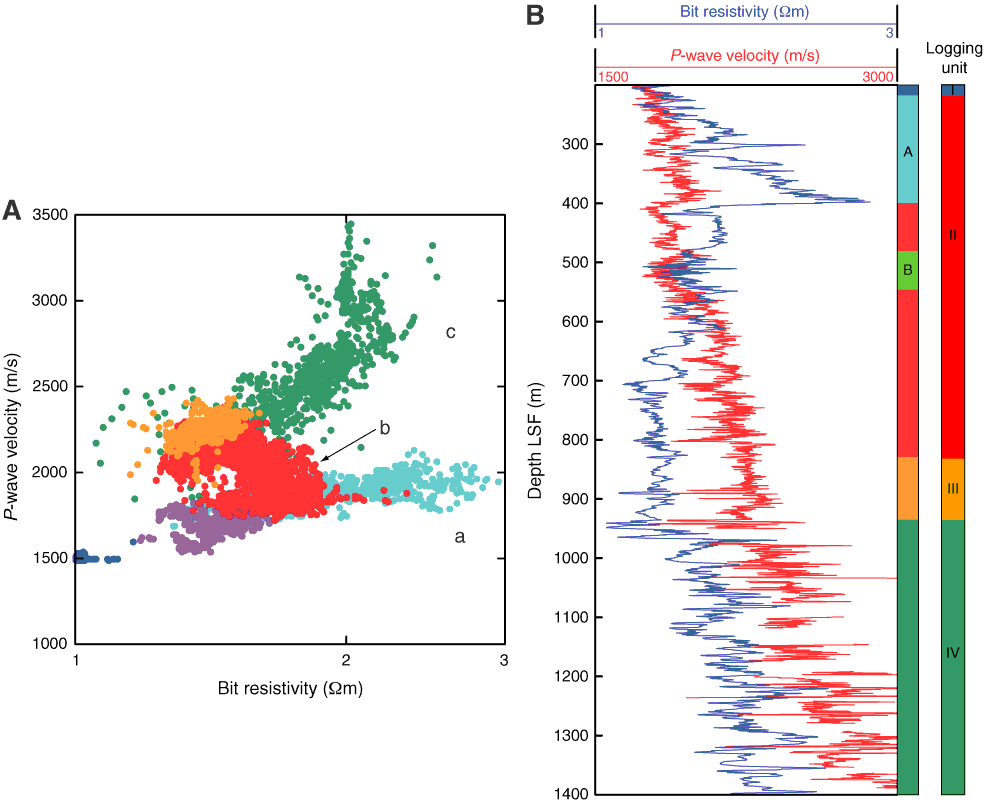
Figure F26. Comparison between sonic P-wave velocity and bit resistivity in Hole C0002A. A. Plot of P-wave velocity vs. bit resistivity. a = basin formations above the bottom-simulating reflector (BSR) (purple and blue), b = basin formations below the BSR (red and orange), c = older accretionary prism (green). Note the resistivity axis is in a logarithmic scale. B. Velocity and resistivity logs.

Previous | Close | Next | Top of page