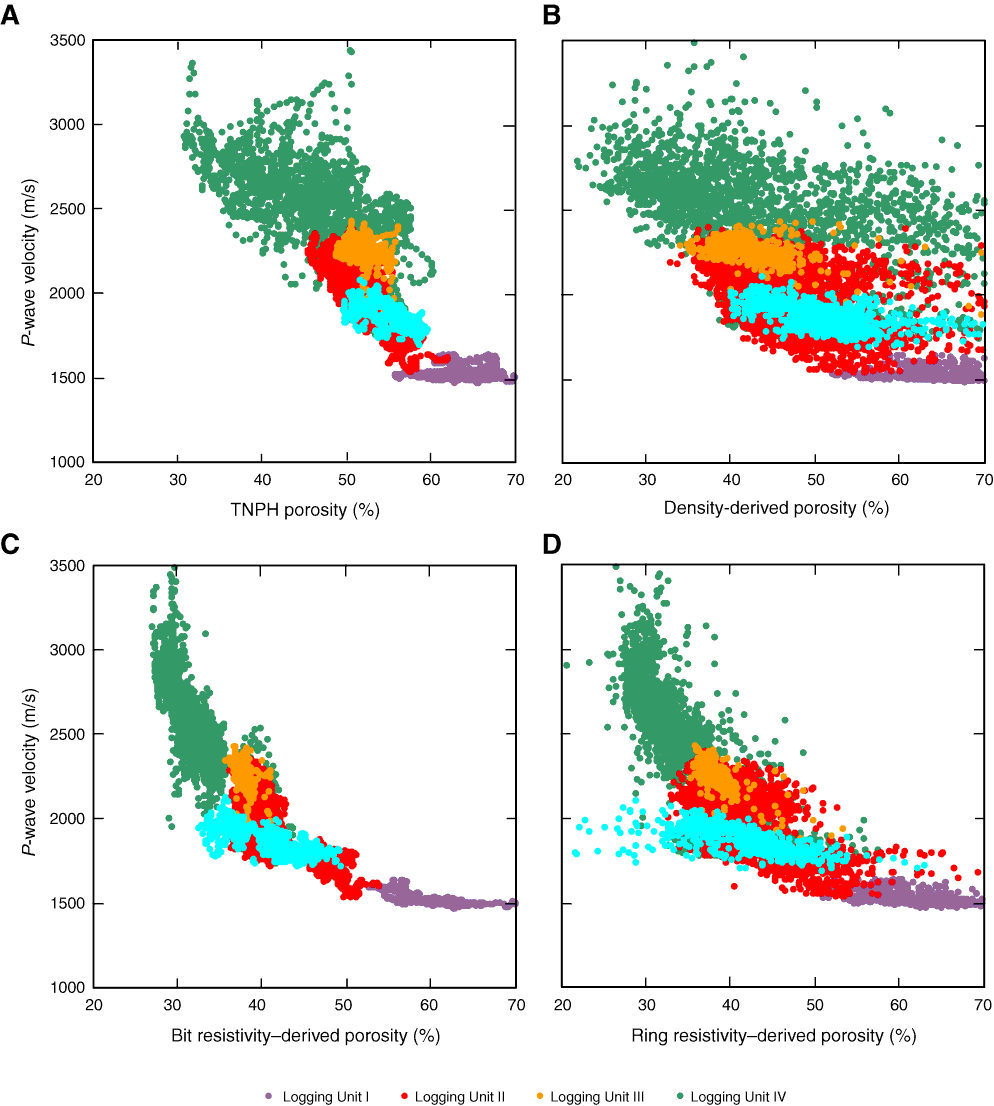
Figure F27. Plots of P-wave velocity vs. (A) neutron porosity, (B) density porosity, (C) bit resistivity–derived porosity, and (D) ring resistivity–derived porosity. Purple and blue = basin formations above the bottom-simulating reflector (BSR), red and orange = basin formations below the BSR, green = older accretionary prism.

Previous | Close | Next | Top of page