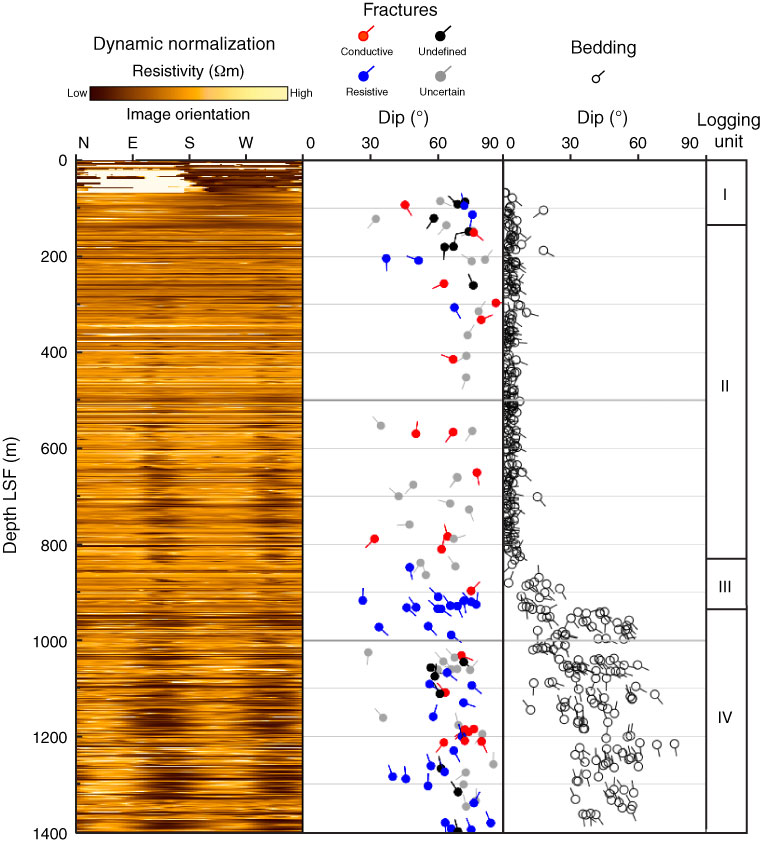
Figure F28. Shallow resistivity image (dynamic normalization) in Hole C0002A showing bedding and fracture orientations, dip, and fracture conductivity. Tadpole lines = dip direction of the plane. LSF = LWD depth below seafloor.

Previous | Close | Next | Top of page