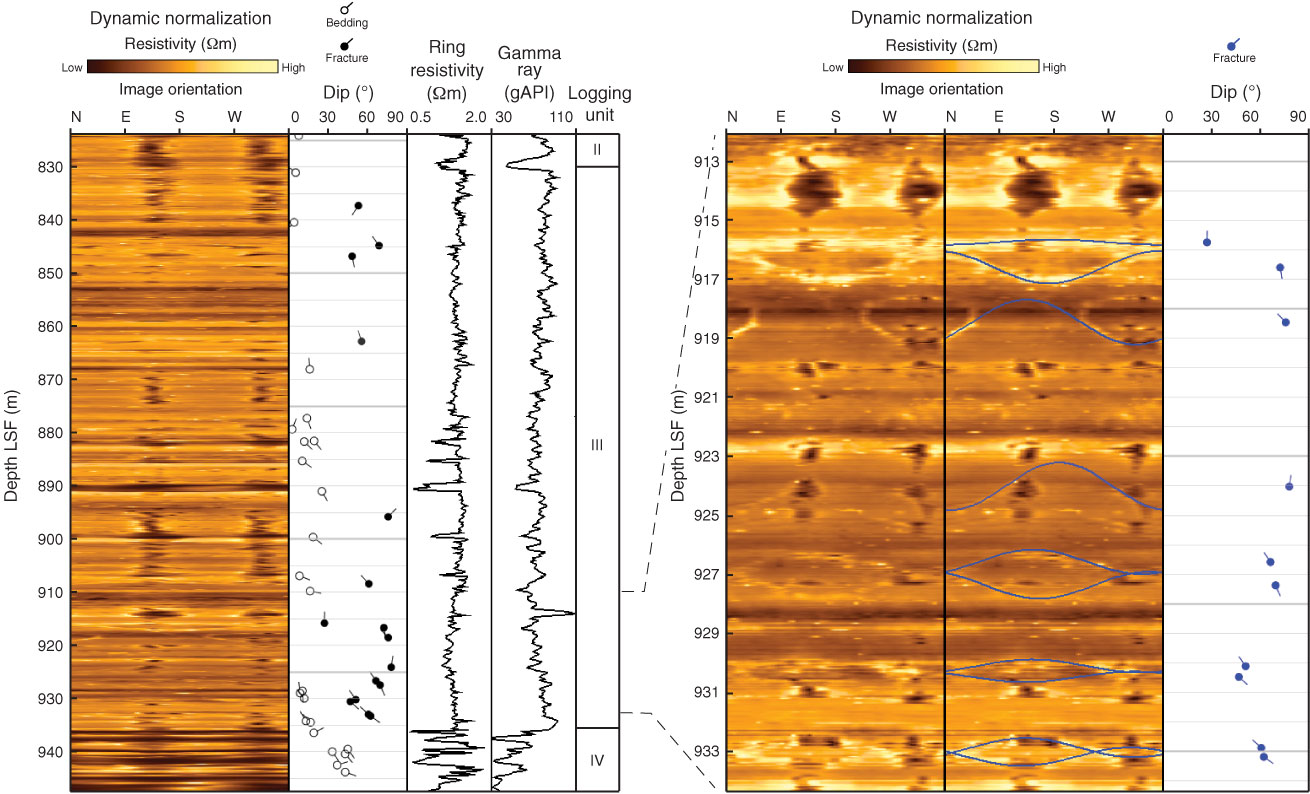
Figure F30. Resistivity image (static normalization shallow) of logging Unit III (830–936 m LWD depth below seafloor [LSF]) with fracture and bedding interpretation and ring resistivity and gamma ray logs. Inset shows fractured base of this unit (~915–935 m LSF). Tadpole lines = dip direction of the plane.
Previous | Close | Next | Top of page