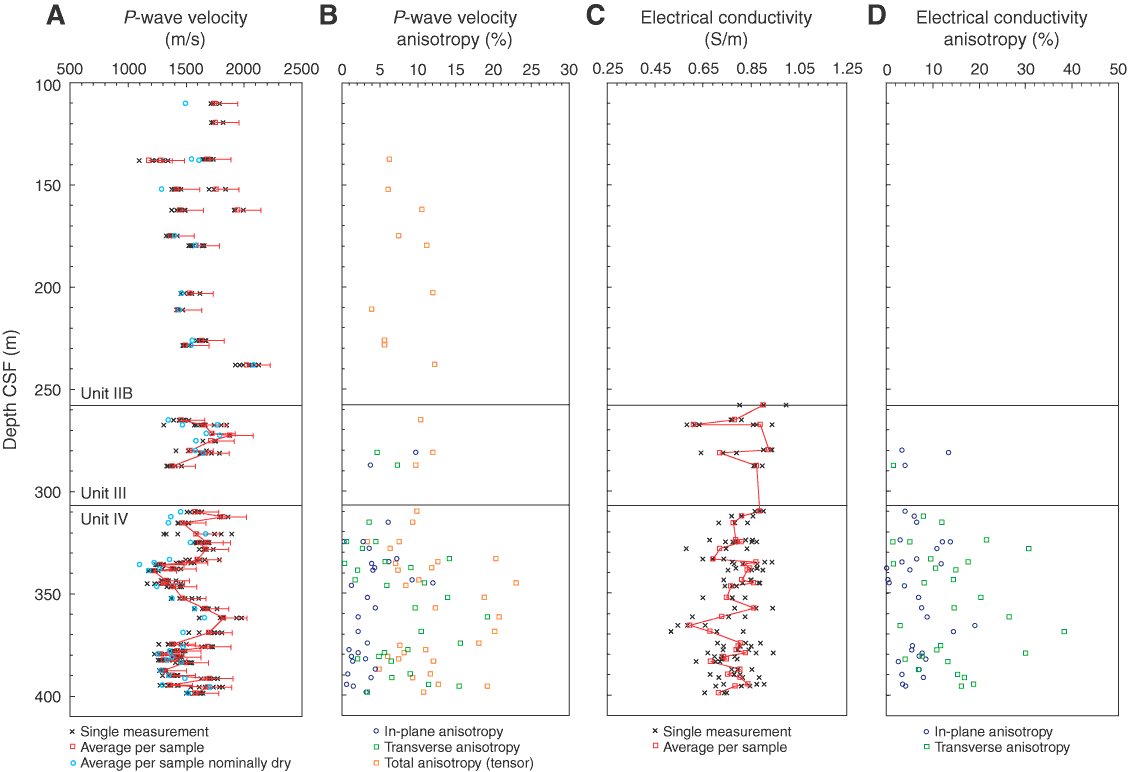
Figure F50. Measurements on discrete samples. A. P-wave velocity. One-sided error bar is associated with partial drying and was estimated experimentally (cf “Expedition 316 methods” chapter). B. Anisotropy of P-wave velocity. Three types of anisotropy are displayed. The in-plane anisotropy (between the two directions perpendicular to the core axis), transverse anisotropy (between core axis and its normal plane), and total anisotropy, calculated from the eigenvalues (7 measurements setup). C. Electrical conductivity. D. Anisotropy of electrical conductivity. CSF = core depth below seafloor.

Previous | Close | Next | Top of page