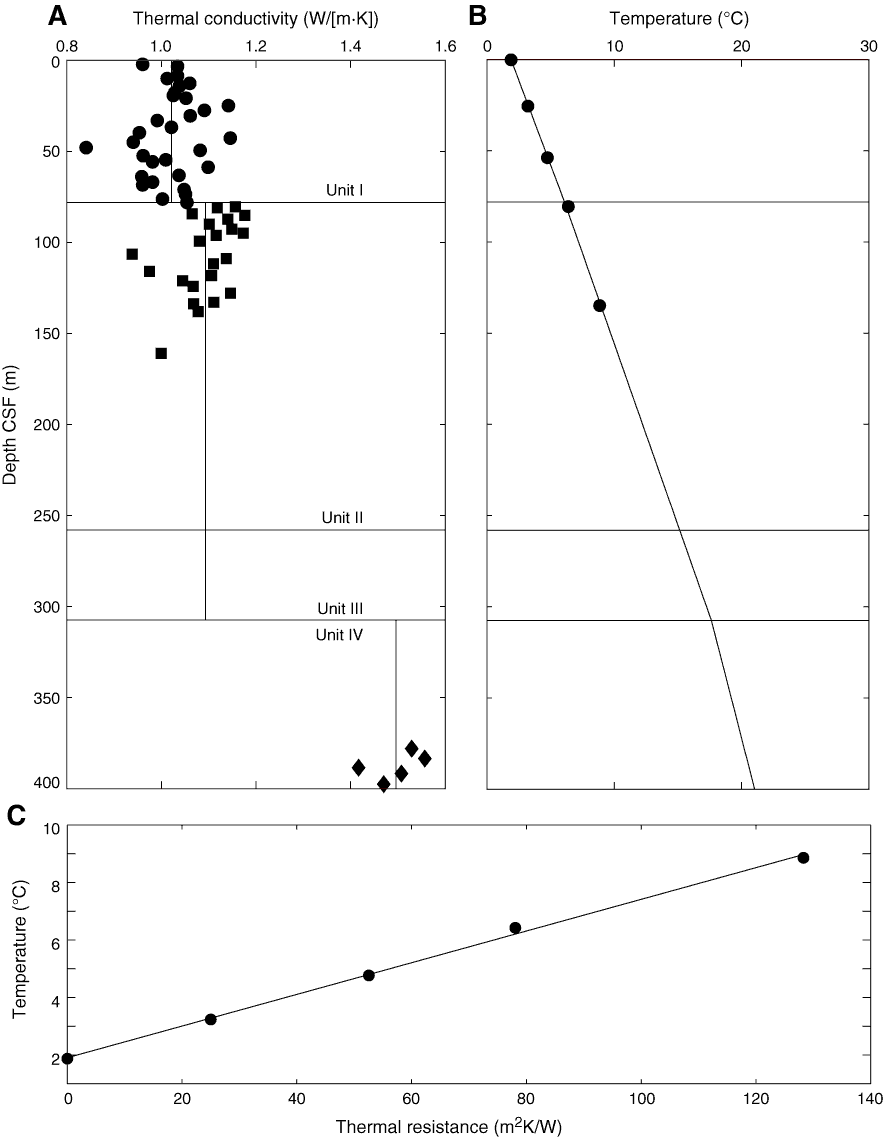
Figure F51. Thermal data, Site C0004. A. Thermal conductivity. Circles = Unit I, squares = Unit II, diamonds = Unit III, vertical lines = unit averages. B. Equilibrium temperatures (circles) and projected temperatures (line). The best-fit linear gradient to the equilibrium temperatures is 52°C/km. C. Temperature as a function of thermal resistance. The best-fit slope gives a heat flow value of 55 mW/m2 and a bottom water temperature of 1.9°C. CSF = core depth below seafloor.
Previous | Close | Next | Top of page