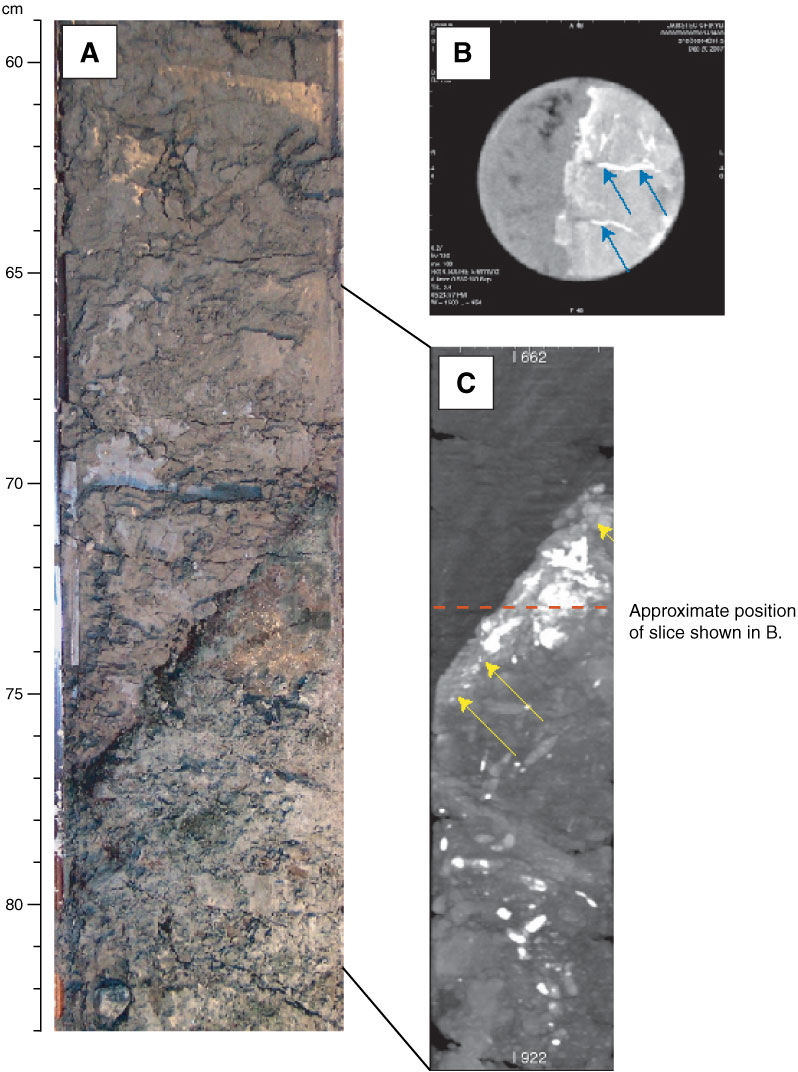
Figure F7. Unconformity between Units I and II (interval 316-C0004C-9H-5, 59–83). A. Visible light image. B. CT image of horizontal slice, looking down on partially pyrite-filled near-vertical fractures (blue arrows) in the breccia just below the unconformity. C. Semitransparent rendering of CT image showing variable density of mineralized breccia at the unconformity. The brightest regions correspond to pyrite mineralization and the medium bright region in the 5 mm just below the contact (yellow arrows) corresponds to an as-yet unidentified mineral that imparts a dark coloration to the rock.
Previous | Close | Next | Top of page