Previous | Close | Next
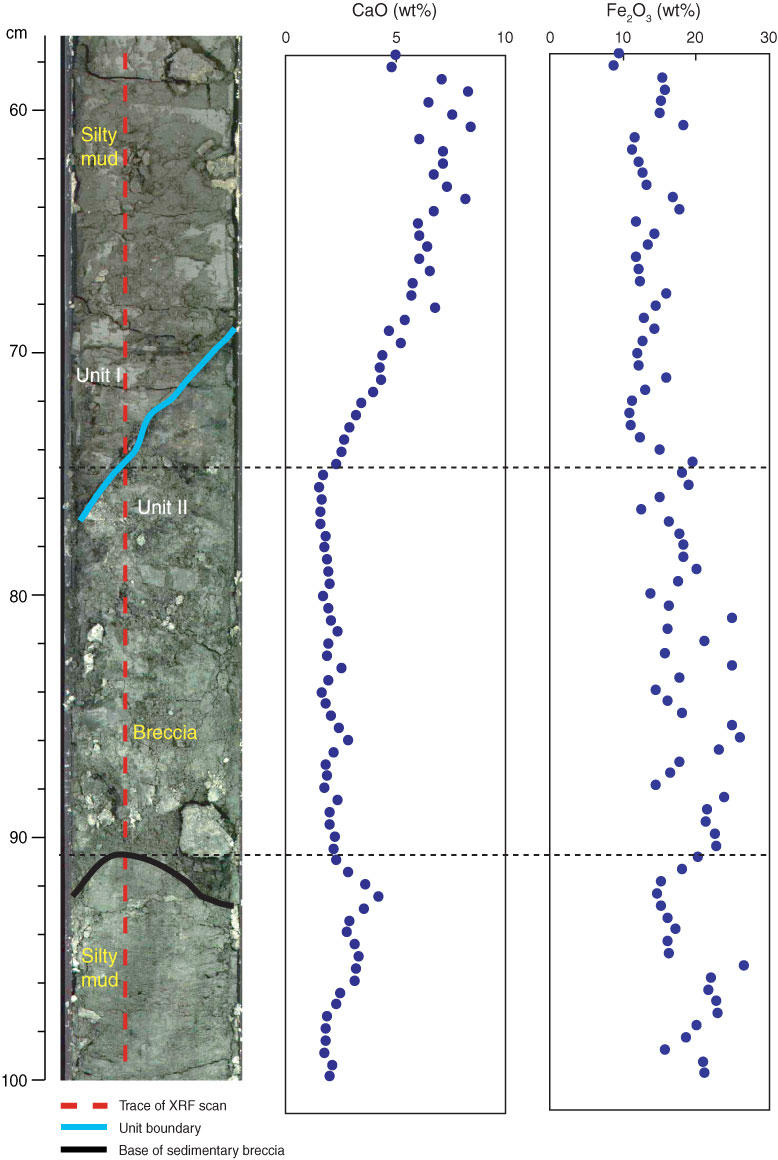
Figure F8. X-ray fluorescence (XRF) scanning data for Ca and Fe across the unconformity (interval 316-C0004C-9H-5, 57–100 cm; 78.06 m CSF)
Previous | Close | Next | Top of page