Previous | Close | Next
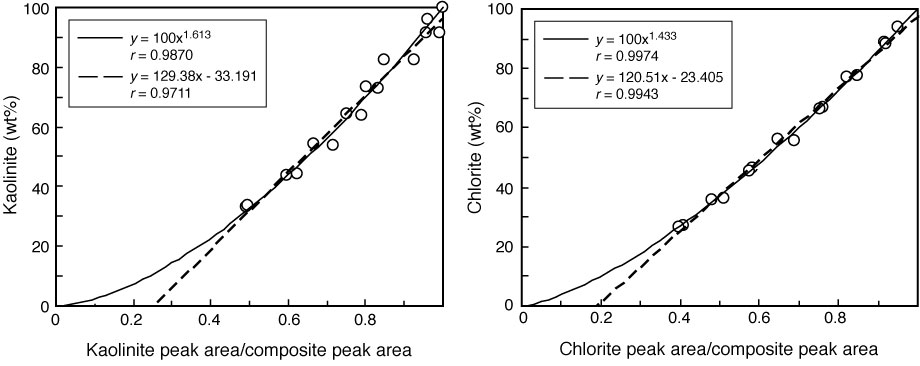
Figure F4. Plots of kaolinite and chlorite abundances versus peak-area ratios. The solid curves represent best fit power-law regression. Dashed lines represent linear regressions. r = correlation coefficient.
Previous | Close | Next | Top of page