Previous | Close | Next
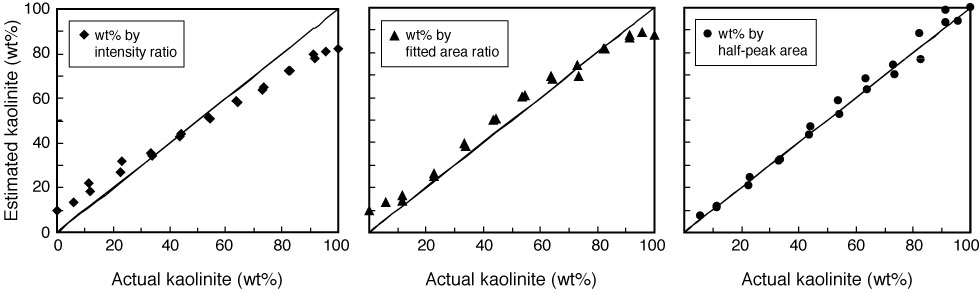
Figure F5. Plots of comparison of errors (known weight percent vs. calculated weight percent) from three different methods. Errors are consistently smaller using half-peak areas.
Previous | Close | Next | Top of page