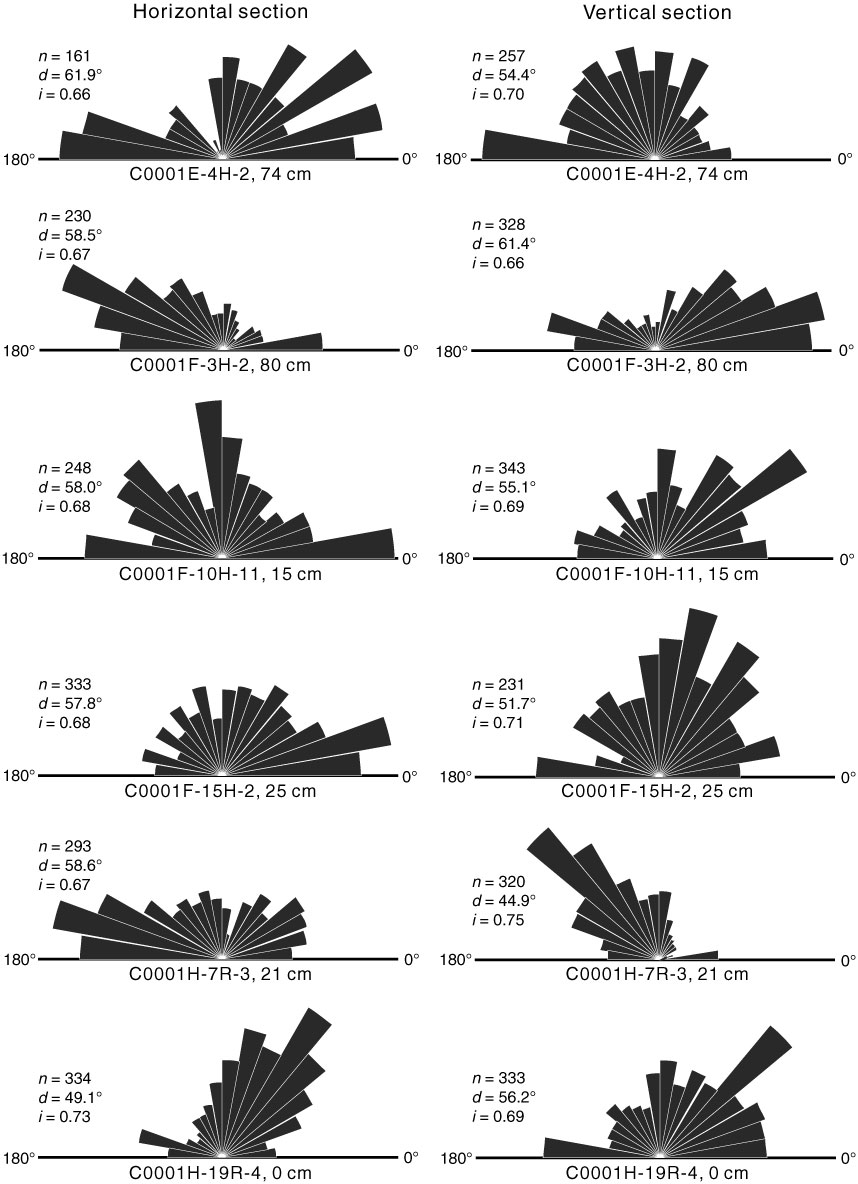
Figure F10. Rose diagrams showing orientation of apparent long axes of particles imaged by environmental scanning electron microscope on the horizontal and vertical sections relative to core axis, Site C0001. n = number of grains counted; d = standard deviation of grain orientation; i = index of microfabric orientation.
Previous | Close | Next | Top of page