Previous | Close
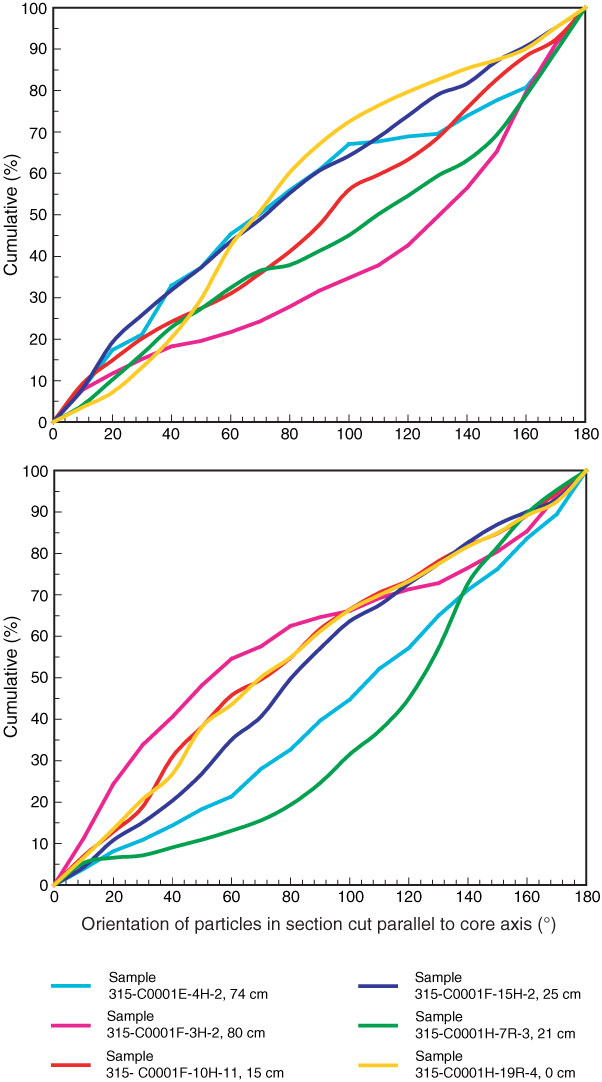
Figure F11. Cumulative frequency curves for apparent orientation of long axes of particles imaged by environmental scanning electron microscope on the horizontal and vertical sections relative to core axis, Site C0001.
Previous | Close | Top of page