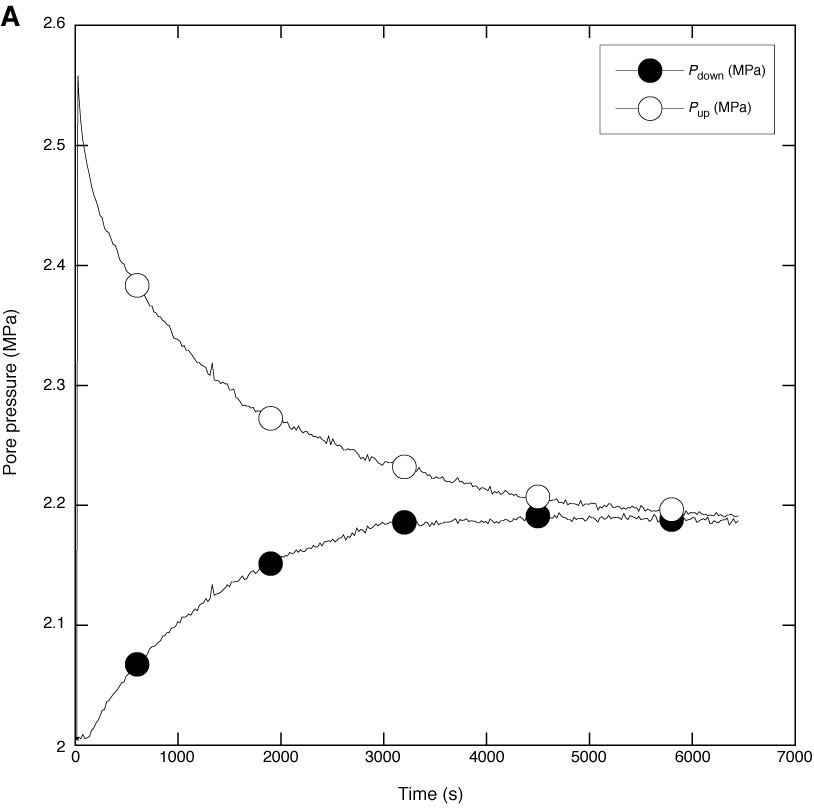
Figure F5. Example plot of pore fluid pressure evolution during a permeability test using the pulse decay method. Test was run on a sample from Section 315-C0001F-18H-6 at 30 MPa effective pressure. A. Curves corresponding to the evolution of pore pressure at both ends of the sample. Pdown = downstream pore fluid pressure, Pup = upstream pore fluid pressure. (Continued on next page.)
Previous | Close | Next | Top of page