Previous | Close | Next
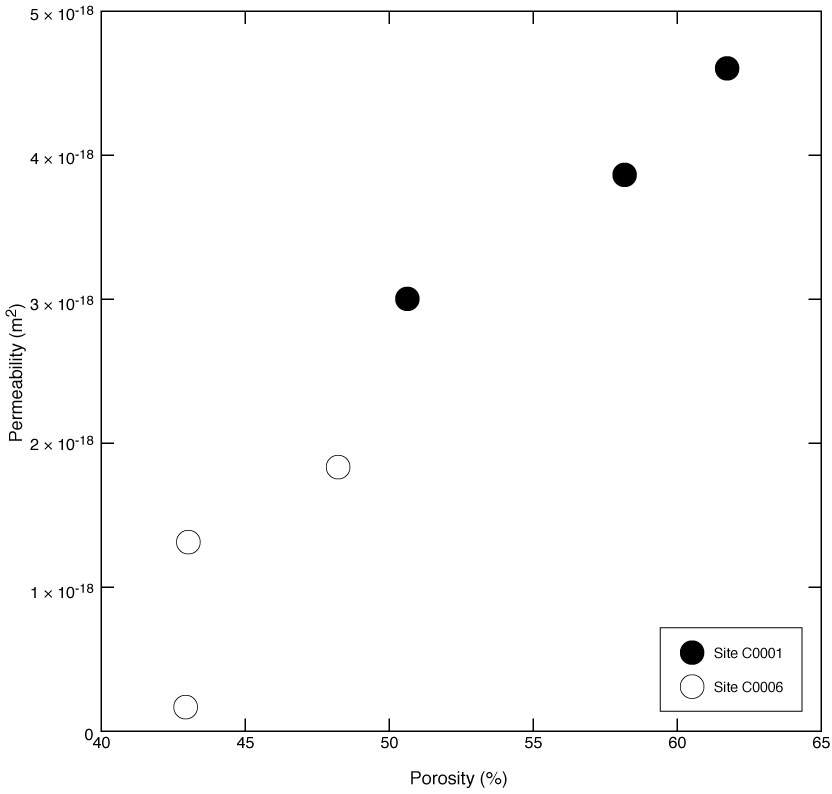
Figure F7. Plot of permeability at initial pressure conditions (PC = 3 MPa and PP = 2 MPa) versus porosity (unstressed state) data for all tested samples, Sites C0001 and C0006.
Previous | Close | Next | Top of page