Previous | Close | Next
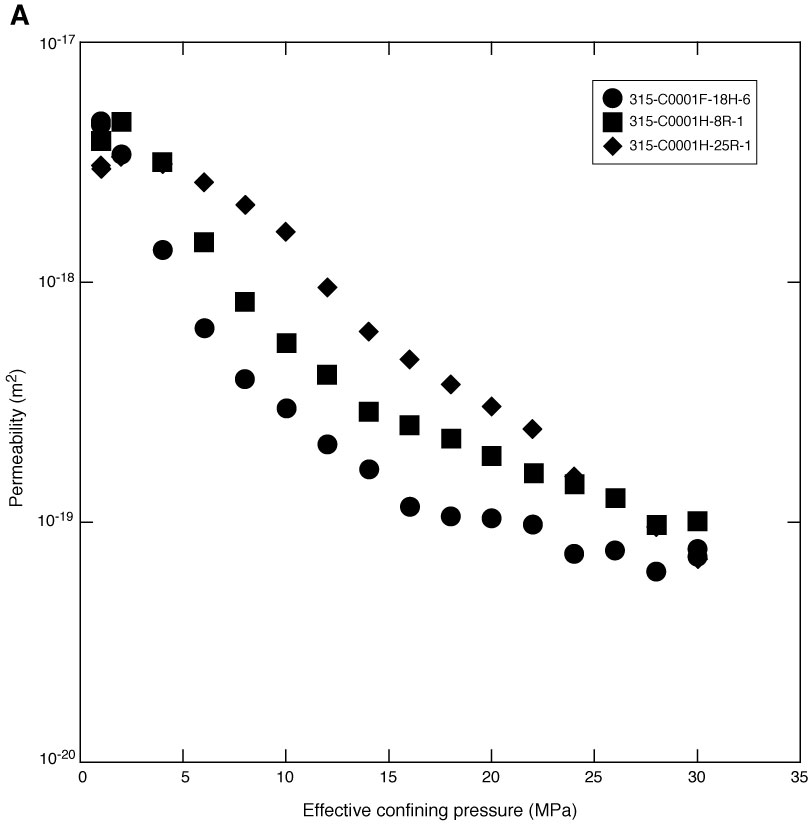
Figure F8. Plots of permeability data as a function of effective confining pressure. A. Site C0001. (Continued on next page.)
Previous | Close | Next | Top of page