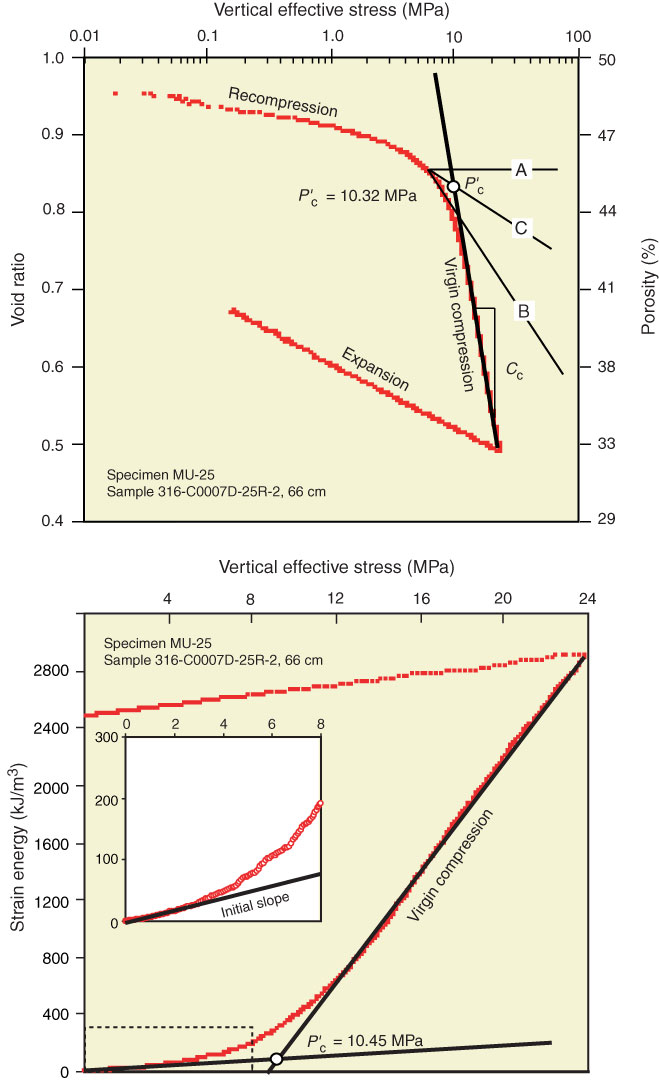
Figure F4. Illustration of methods to determine the maximum value of vertical effective stress (P′c) from the results of CRSC tests. Plot of void ratio vs. vertical effective stress shows determination of P′c following Casagrande (1936). Plot of strain energy density vs. vertical effective stress shows the work (SED) method of Becker et al. (1987), where P′c is defined by the intersection of line segments fit to the initial slope of the reloading curve (enlarged in insert) and to the virgin compression curve.
Previous | Close | Next | Top of page