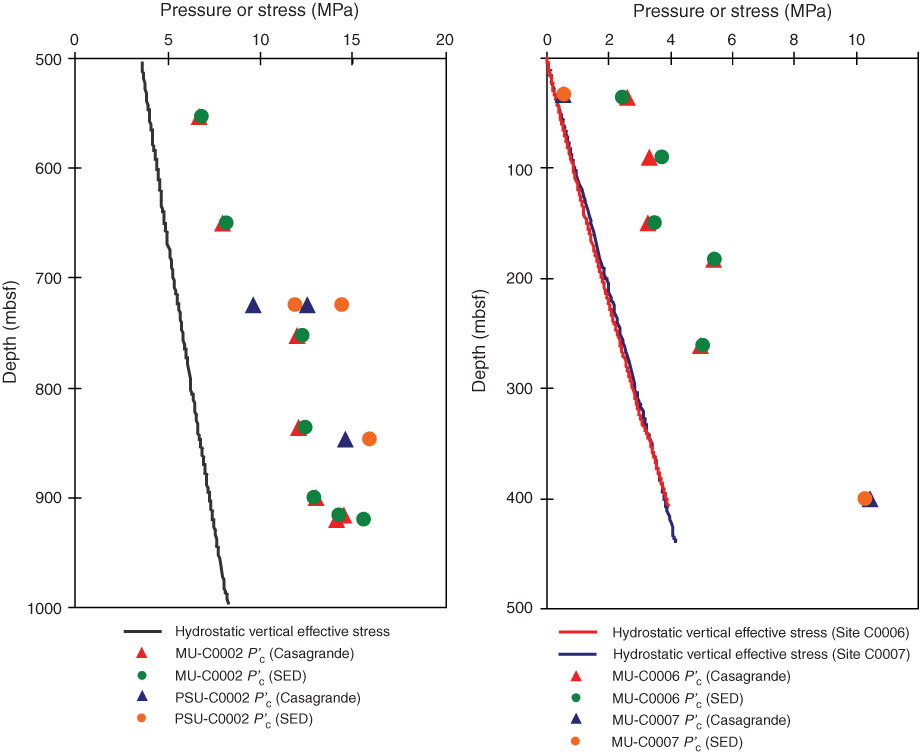
Figure F5. Plot of P′c values from CRSC tests (Fig. F4) vs. burial depth at Sites C0002, C0006, and C0007. Reference curves for hydrostatic vertical effective stress σ′vh at each site were derived by subtracting hydrostatic pore pressure from the values of total normal stress exerted by overburden. Overburden stress is constrained by integrating the shipboard bulk density and depth data (see the “Expedition 315 Site C0002” [Expedition 315 Scientists, 2009], “Expedition 316 Site C0006” [Expedition 316 Scientists, 2009b], and “Expedition 316 Site C0007” [Expedition 316 Scientists, 2009c] chapters).
Previous | Close | Next | Top of page