Previous | Close | Next
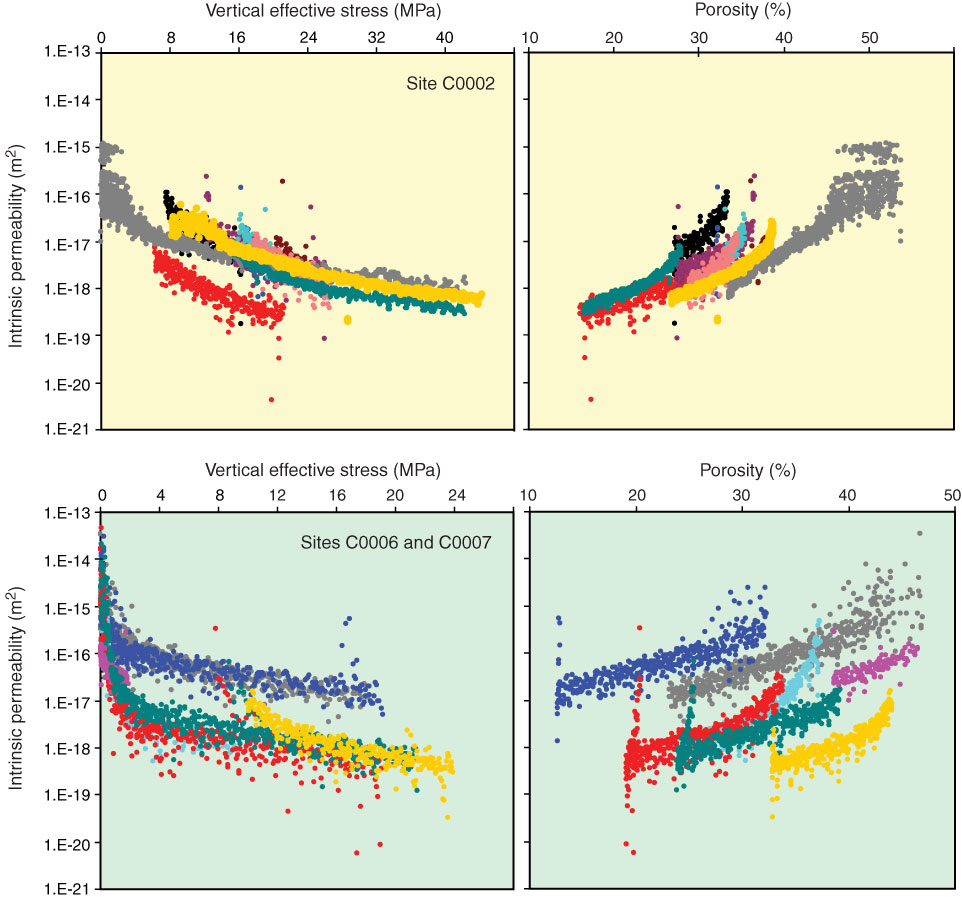
Figure F6. Intrinsic permeability values obtained during CRSC tests (equation 4) plotted as a function of vertical effective stress and porosity. Specimens are from Sites C0002, C0006, and C0007.
Previous | Close | Next | Top of page