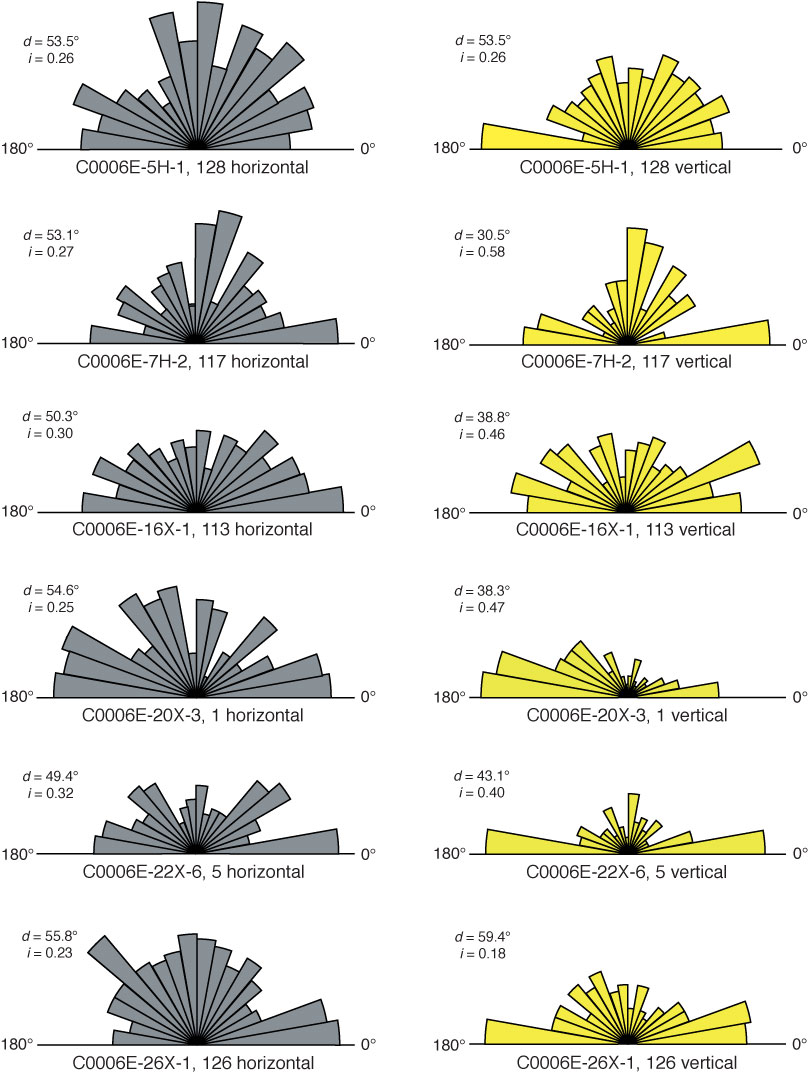
Figure F10. Rose diagrams showing orientation of grains (apparent long axis) measured on environmental scanning electron microscope (ESEM) images from sections cut parallel and perpendicular to the core axis. See Figure F9 for the corresponding ESEM images. Also shown are values of standard deviation (d) for grain orientation and the microfabric orientation index (i). (Continued on next page.)
Previous | Close | Next | Top of page