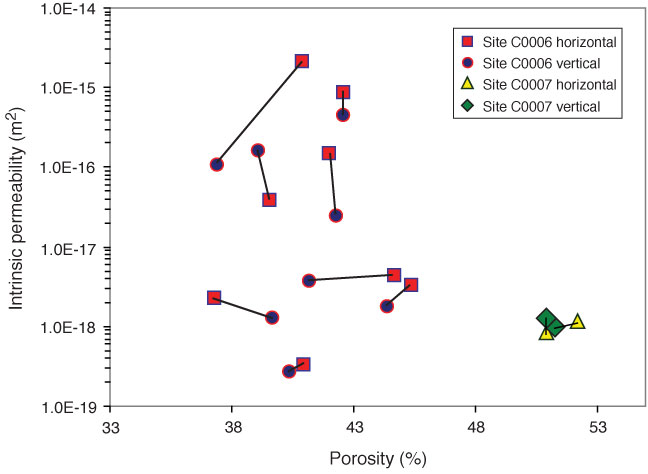
Figure F8. Plot of relation between intrinsic permeability and porosity for test specimens from Sites C0006 and C0007. Permeability was measured at an effective stress of 0.55 MPa. Porosity values are for post-test specimens.
Previous | Close | Next | Top of page