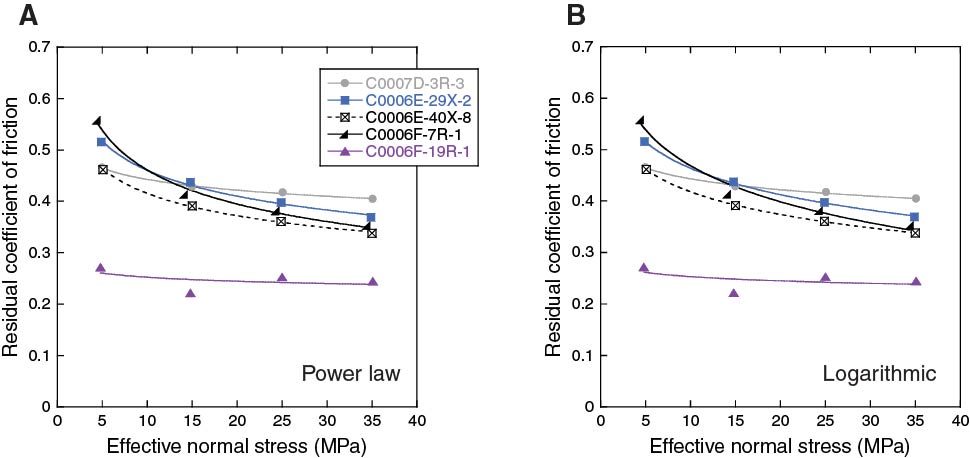
Figure F7. Comparison of (A) Power law and (B) logarithmic fits to the residual coefficient of friction as a function of effective normal stress data shown in Figure F6, Holes C0006 and C0007. Note that the two forms fit the data nearly identically well. See Table T3 for fit parameters.
Previous | Close | Next | Top of page