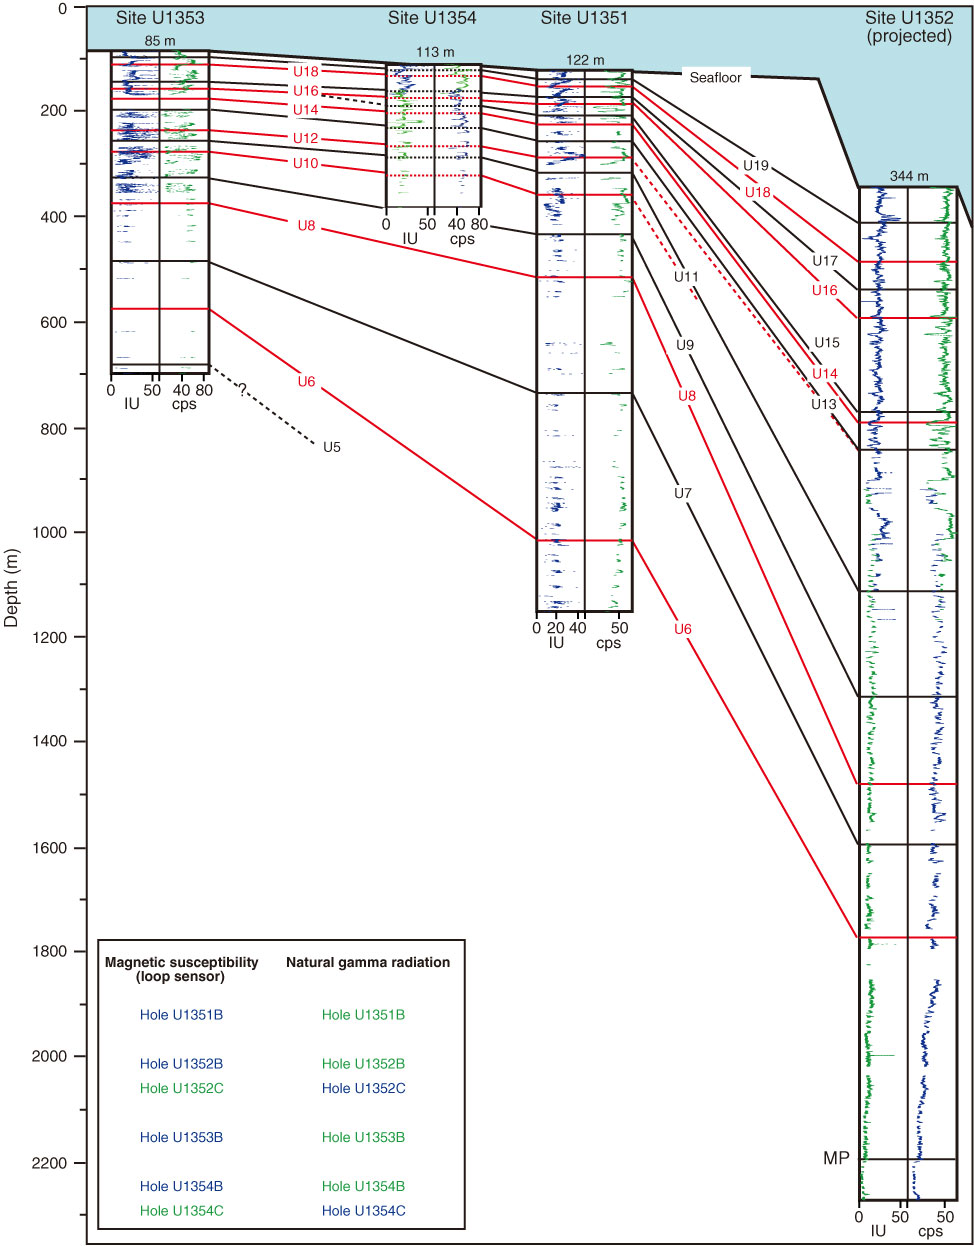
Figure F23. Magnetic susceptibility (left-hand column) was measured on whole-round samples at 2.5 cm intervals (instrument units [IU]) using a Bartington Instruments MS Loop sensor. NGR (right-hand column) was measured on whole-round samples at 10 cm intervals (counts per second [cps]) using the Natural Gamma Radiation Logger (NGRL) designed and built at Texas A&M University by IODP-USIO. To help illustrate key trends, the signal was cleaned using a Gaussian low-pass filter (30 passes). The data correlate well between the two methods and between sites: both data sets show similar cyclic patterns in the uppermost ~250 m at all sites. Some unconformities are well represented by abrupt changes. The Marshall Paraconformity (MP) is characterized at Site U1352 by a switch to negative magnetic susceptibility and a decrease in NGR to nearly zero.
Previous | Close | Next | Top of page