Previous | Close | Next
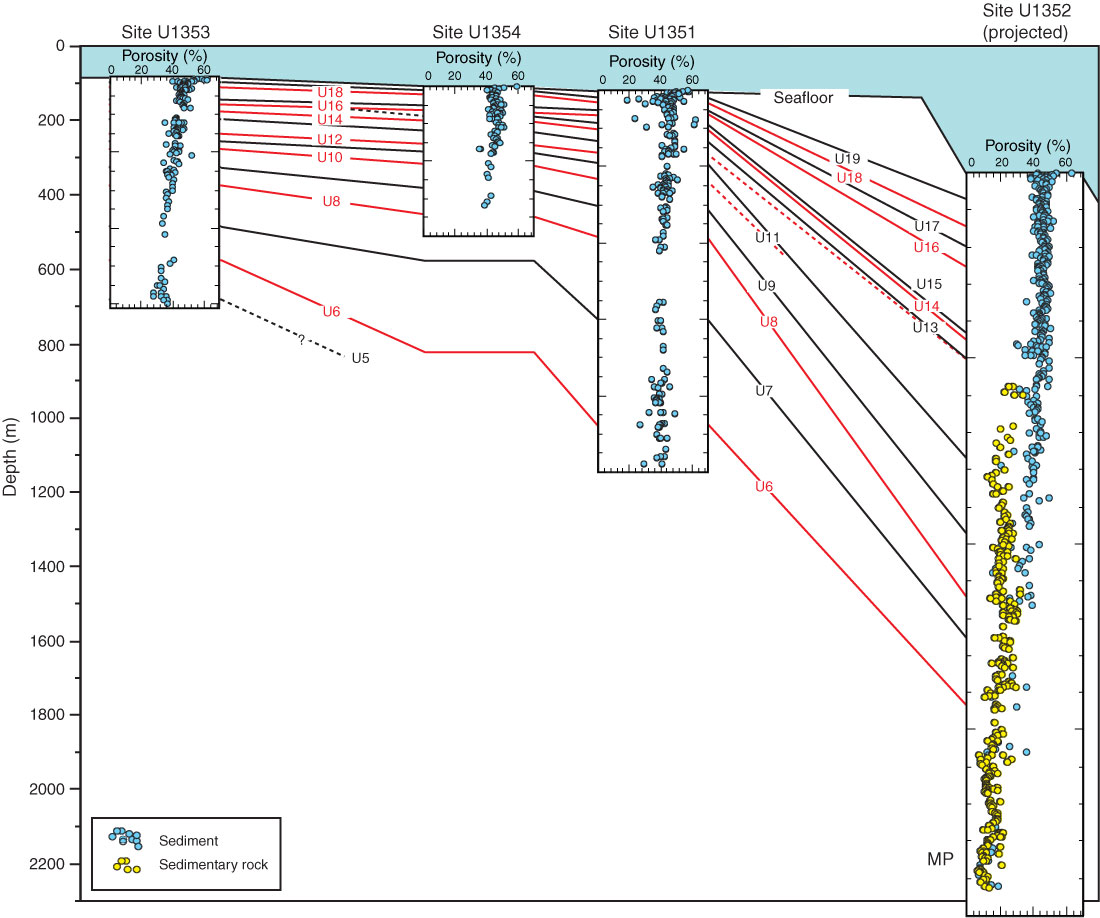
Figure F32. Porosity vs. depth curves, Expedition 317. Seismic sequence boundaries U19–U5 are shown schematically, intersecting each site at their predicted depths. MP = Marshall Paraconformity.
Previous | Close | Next | Top of page