Previous | Close | Next
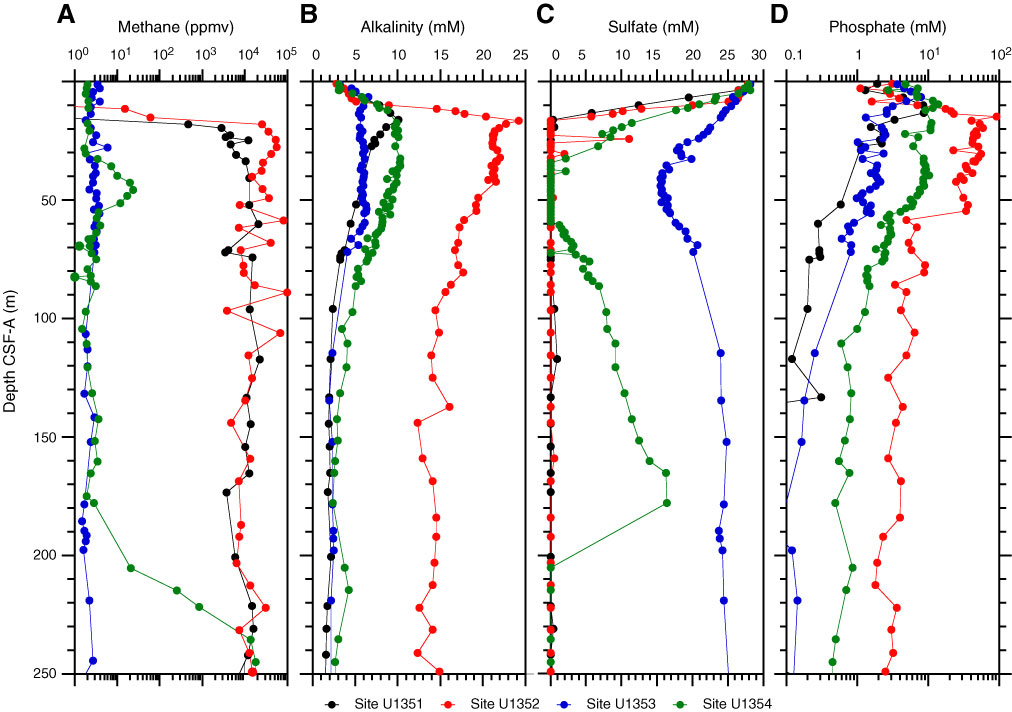
Figure F33. Variation of (A) methane, (B) alkalinity, (C) sulfate, and (D) phosphate concentrations over the uppermost 250 m, Expedition 317.
Previous | Close | Next | Top of page