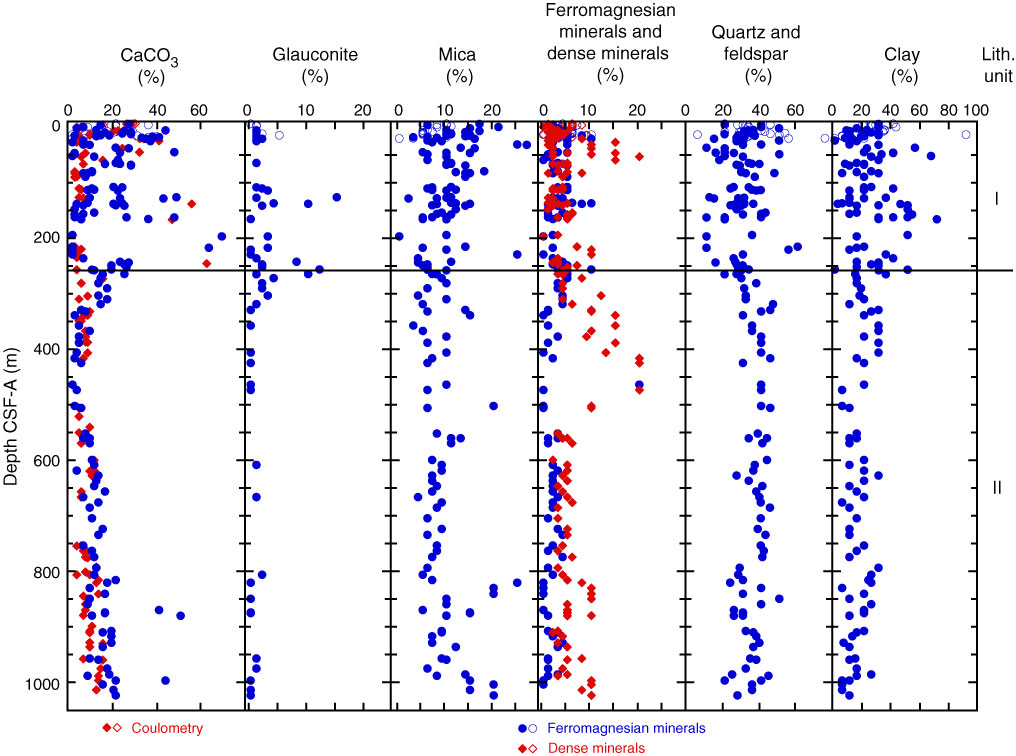
Figure F23. Plots of mineral concentration estimates based on smear slide data from Holes U1351A (open symbols) and U1351B (solid symbols). CaCO3 estimates are plotted against data from coulometry analyses for comparison. Solid line = Unit I/II boundary.
Previous | Close | Next | Top of page