Previous | Close | Next
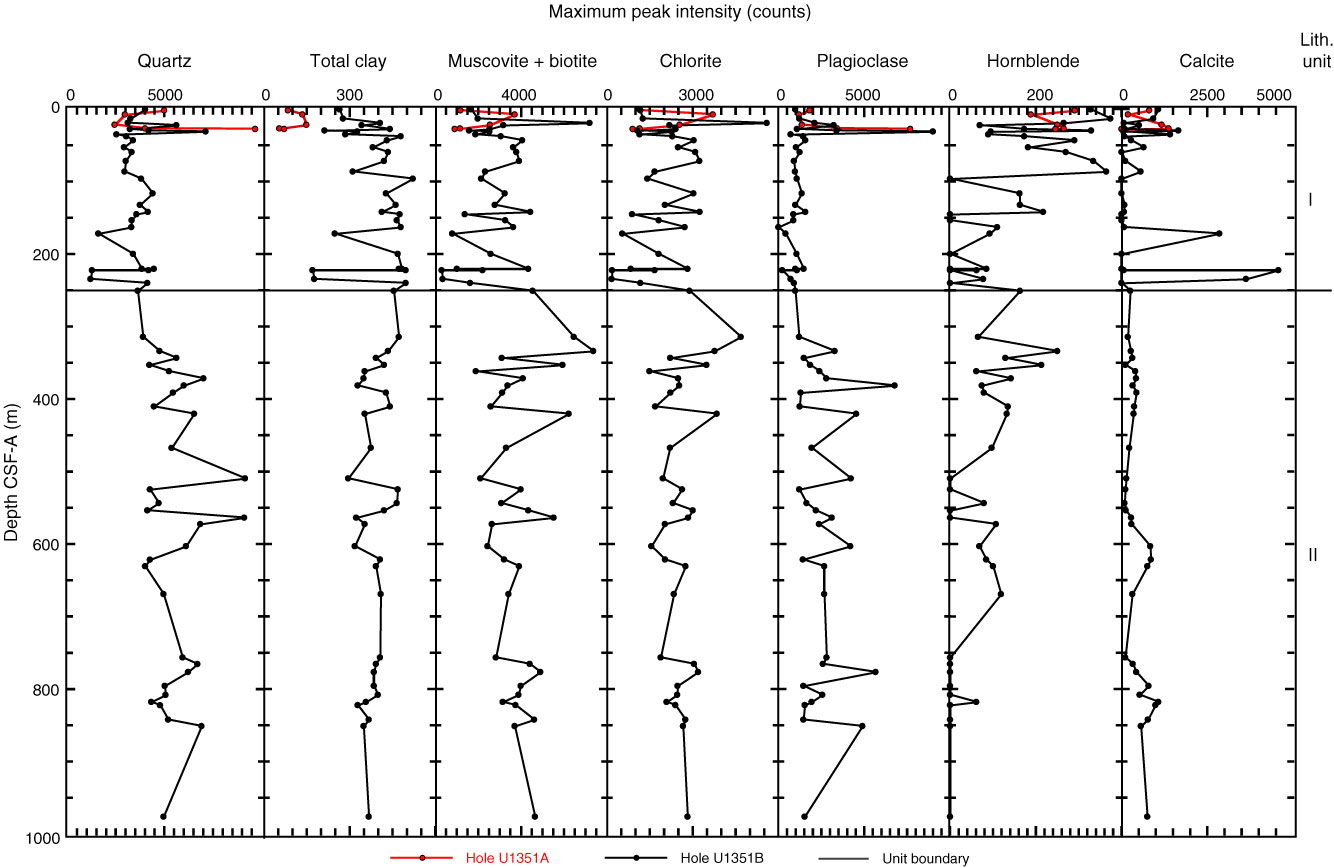
Figure F22. Plots of relative maximum peak intensity in XRD analyses of common minerals, Holes U1351A and U1351B.
Previous | Close | Next | Top of page