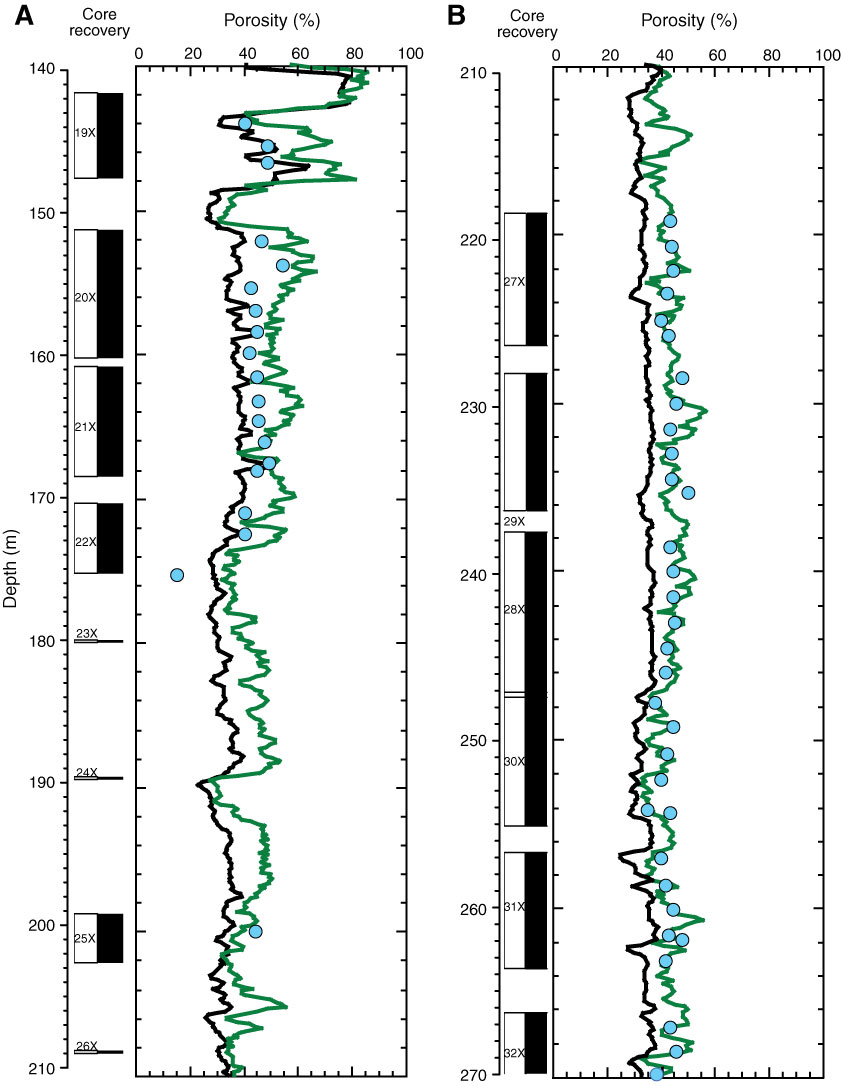
Figure F44. Detailed comparison of porosity results shown in Figure F35 for (A) 140–210 m, where hole size was <20 inches (based on downhole logs), and (B) 210–270 m, where hole size was >20 inches (based on downhole logs). Black = porosity derived from downhole density log, green = neutron porosity from downhole logs, blue = MAD porosity. Depth (m) refers to CSF-A for MAD results and to WMSF for downhole logging data.
Previous | Close | Next | Top of page