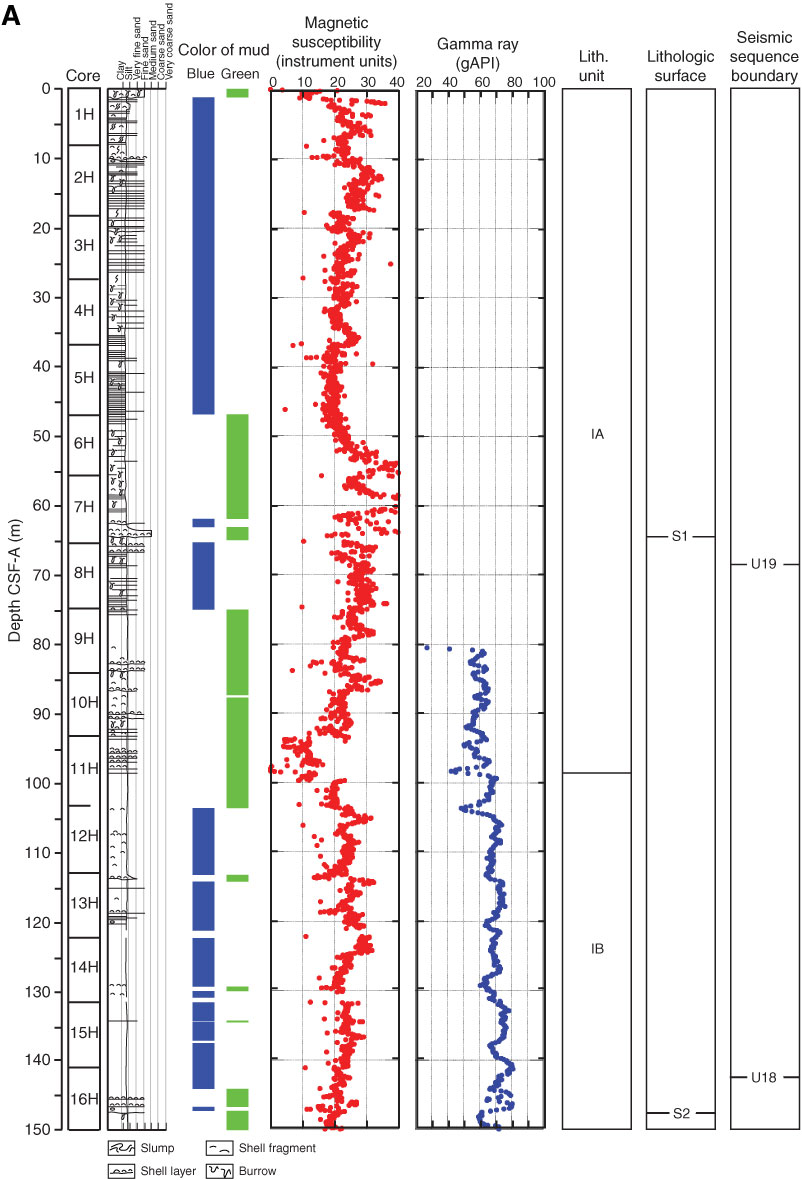
Figure F19. Comparison of downhole gamma ray logs, magnetic susceptibility, lithology, lithologic surfaces identified in core description, and predicted depths of seismic sequence boundaries, Hole U1352B. Downhole logging data are plotted on the WMSF depth scale. A. 0–150 m CSF-A. (Continued on next two pages.)
Previous | Close | Next | Top of page