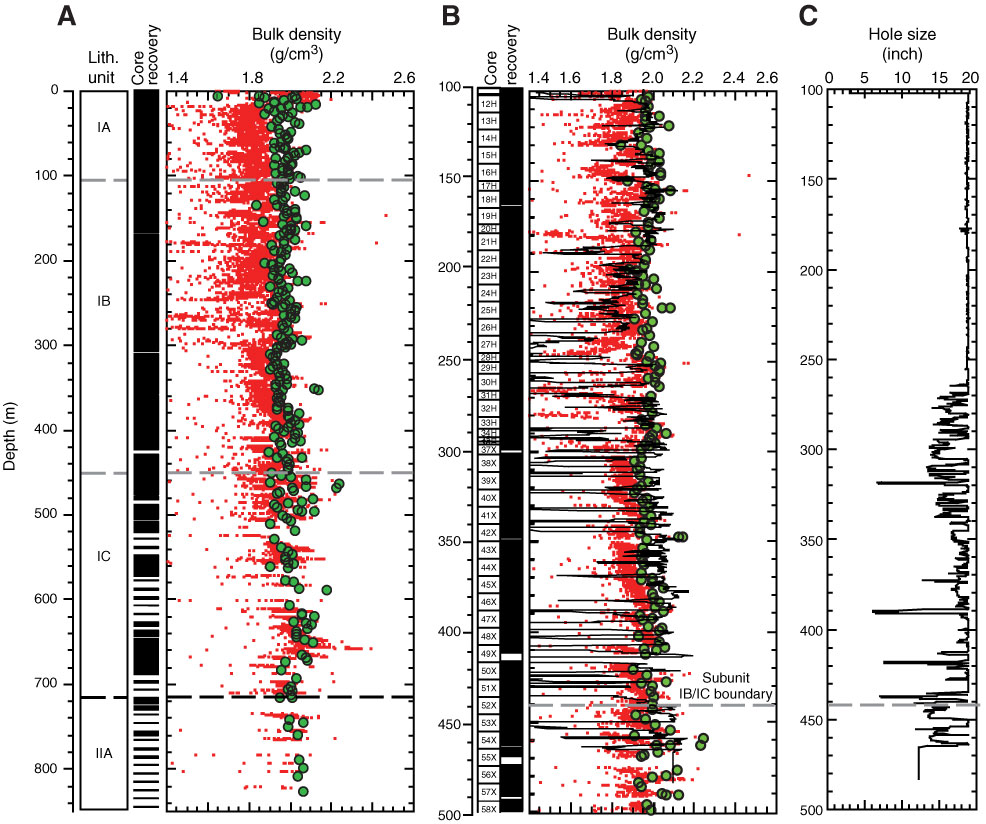
Figure F35. A, B. Comparison of GRA bulk density (red), MAD bulk density (green), and density from downhole logs (black) in Hole U1352B. Lithologic units are indicated in the vertical columns to the left and by the dashed lines. Core recovery information (black = recovered intervals) is also shown. (A) 0–800 m. (B) 100–500 m. C. Hole size, based on caliper measurements during downhole logging. Note that depth (m) refers to CSF-A for GRA core data and MAD results and to WMSF for downhole logging data.
Previous | Close | Next | Top of page