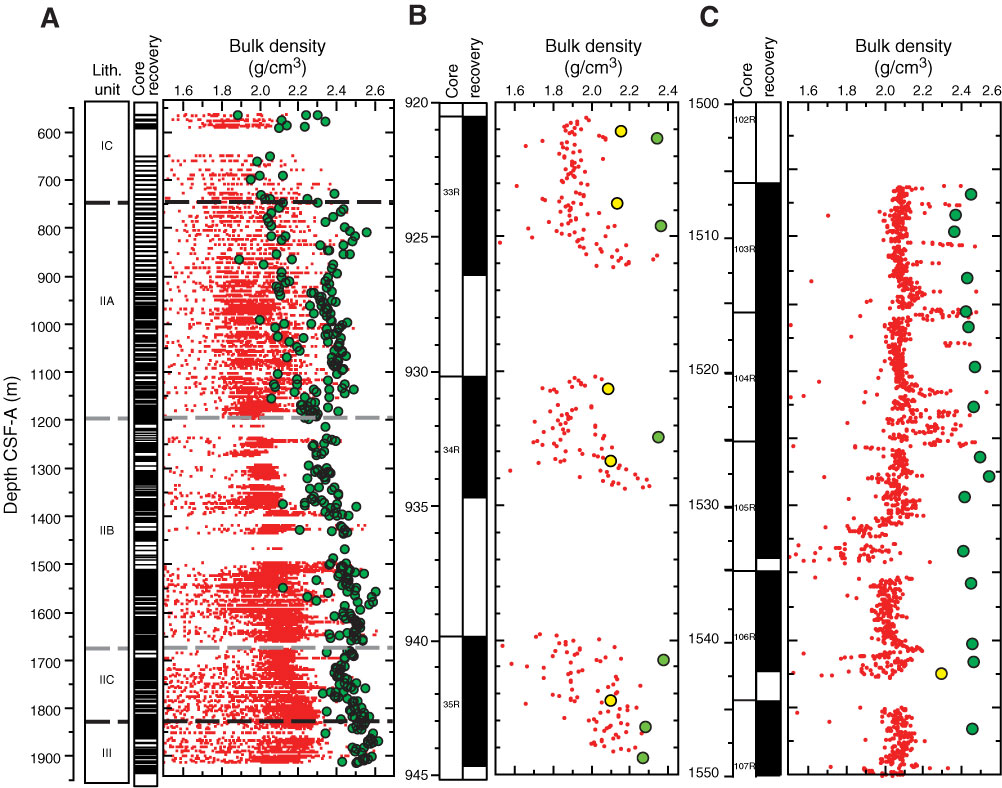
Figure F36. Comparison of GRA bulk density (red) and MAD bulk density (green) in Hole U1352C. Lithologic units are indicated in the vertical column to the left and by the dashed lines in A. Core recovery information (black = recovered intervals) is also shown. A. 550–1950 m CSF-A. B. 920–945 m CSF-A. C. 1500–1550 m CSF-A. In B and C, MAD estimates made on sediments (yellow circles) are differentiated from those made on indurated samples (green circles).
Previous | Close | Next | Top of page