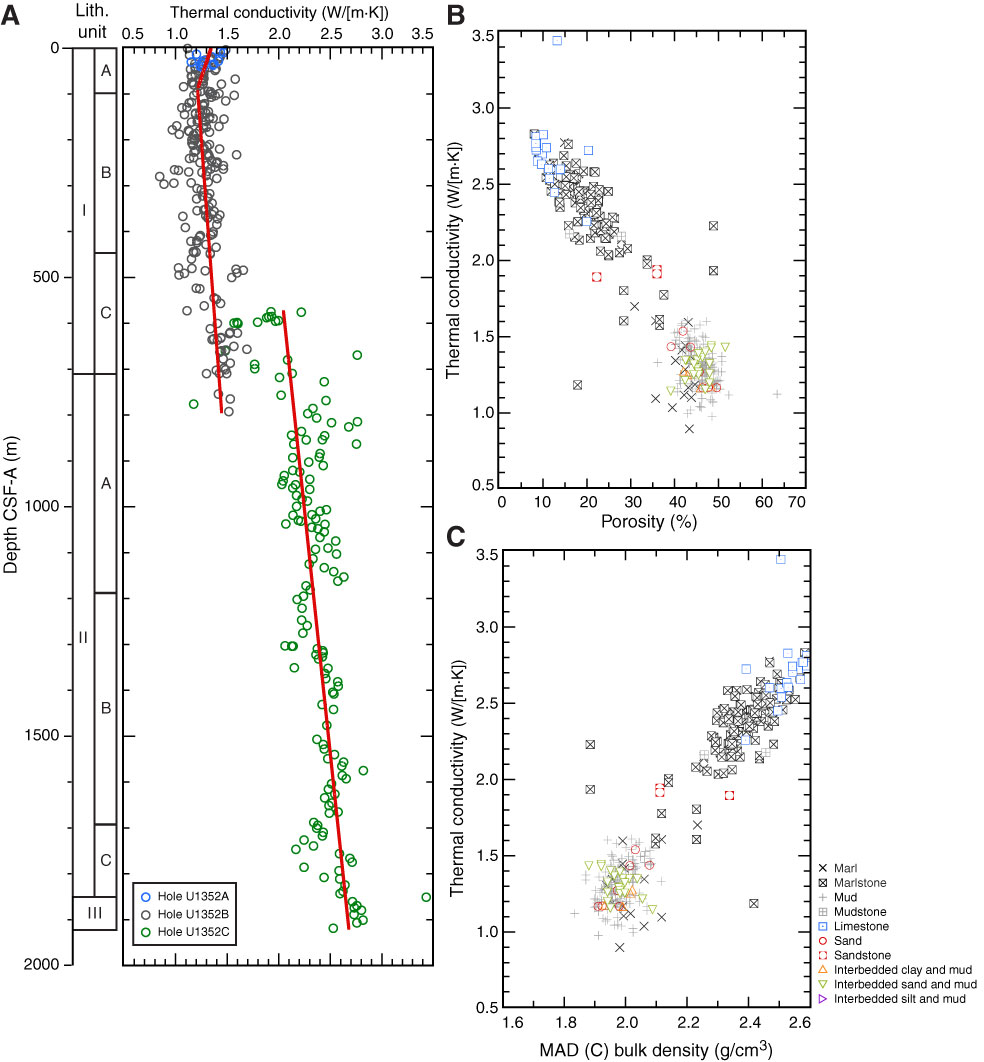
Figure F65. Thermal conductivity for Site U1352 vs. (A) depth, (B) porosity, and (C) bulk density. Thermal conductivity measurements for Holes U1352A, U1352B, and U1352C were used to determine the relationship between thermal conductivity and depth. Linear fits represent increasing thermal conductivity within each depth interval. Thermal conductivity exhibits a negative relationship with porosity and a positive relationship with bulk density. Variation with lithology is weak but detectable. MAD (C) = moisture and density Method C.

Previous | Close | Next | Top of page