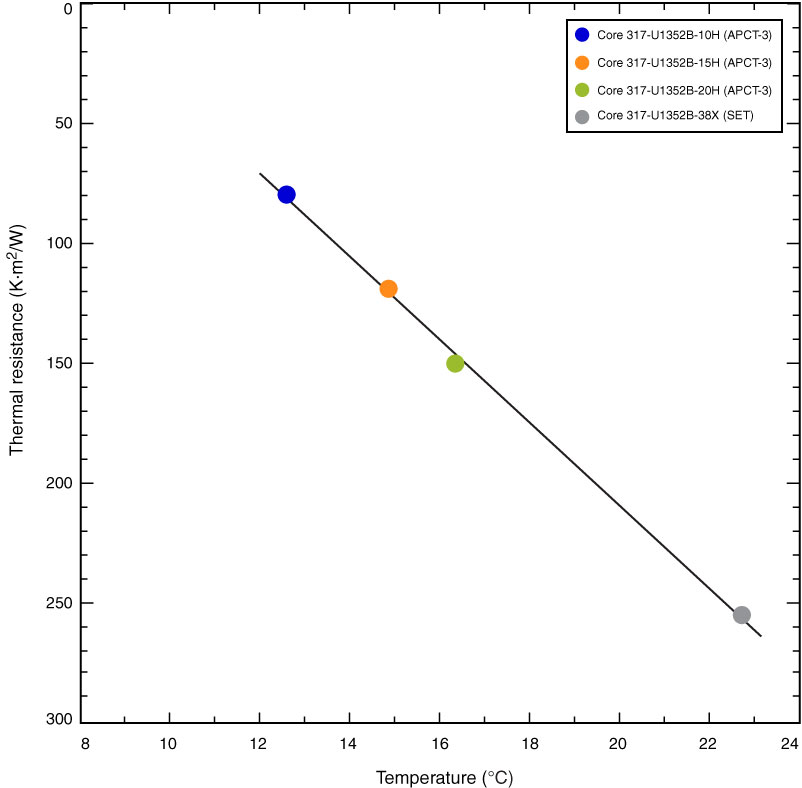
Figure F66. Bullard plot for Site U1352. Thermal resistance is derived from the linearly increasing trend of thermal conductivity with depth in the 94–313 m CSF-A depth interval, where the geothermal gradient was successfully established. The estimated heat flow is 57.8 mW/m2, which is consistent with the regional heat flow distribution in New Zealand (Reyes, 2007). Solid circles = reliable data points. APCT-3 = third-generation advanced piston corer temperature tool, SET = Sediment Temperature tool.
Previous | Close | Next | Top of page