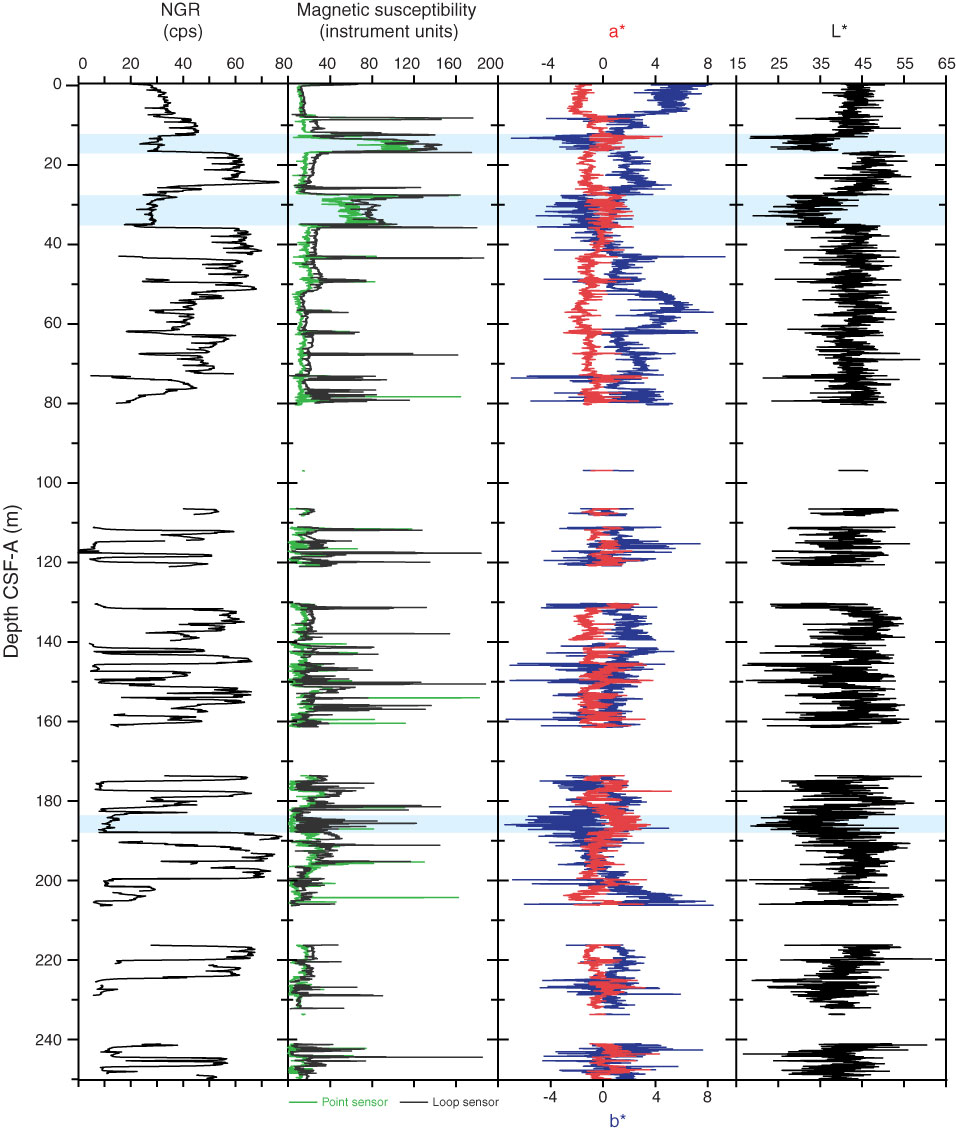
Figure F28. L*a*b* color parameters for the uppermost 250 m of Hole U1353B, plotted alongside magnetic susceptibility (loop and point sensors) and natural gamma radiation (NGR). Blue shaded bars indicate intervals where L* and b* values decrease pronouncedly and a* values increase. The two intervals where this occurs between 13 and 36 m are associated with low NGR and high magnetic susceptibility and are sandy, whereas the interval between 183 and 189 m is associated with both low NGR and low magnetic susceptibility and is coincident with a gravel unit (see text for discussion).
Previous | Close | Next | Top of page