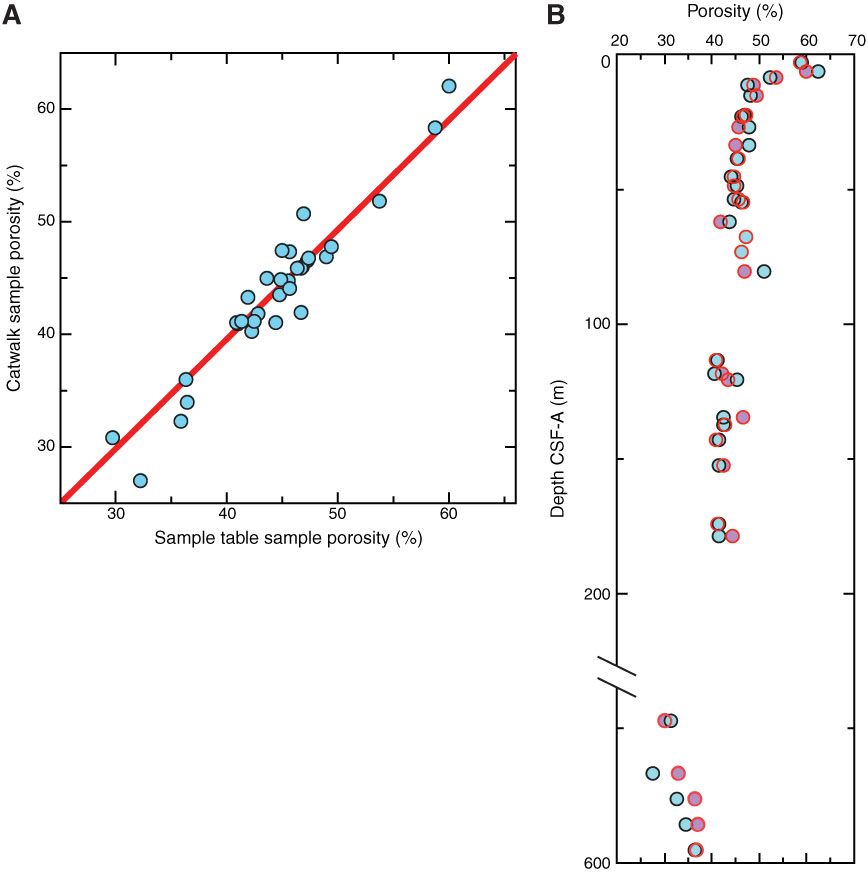
Figure F29. Comparison of porosity from MAD catwalk samples and adjacent samples taken at the sample table in the normal manner. A. Cross-plot of results from the two sampling methods. Samples below the line had more water on the sample table, whereas those above the line had more water when collected immediately on the catwalk. B. Results from the two sampling methods plotted as a function of depth. Blue = catwalk samples, red = sample table samples. Note the scale break between 200 and 540 m.

Previous | Close | Next | Top of page