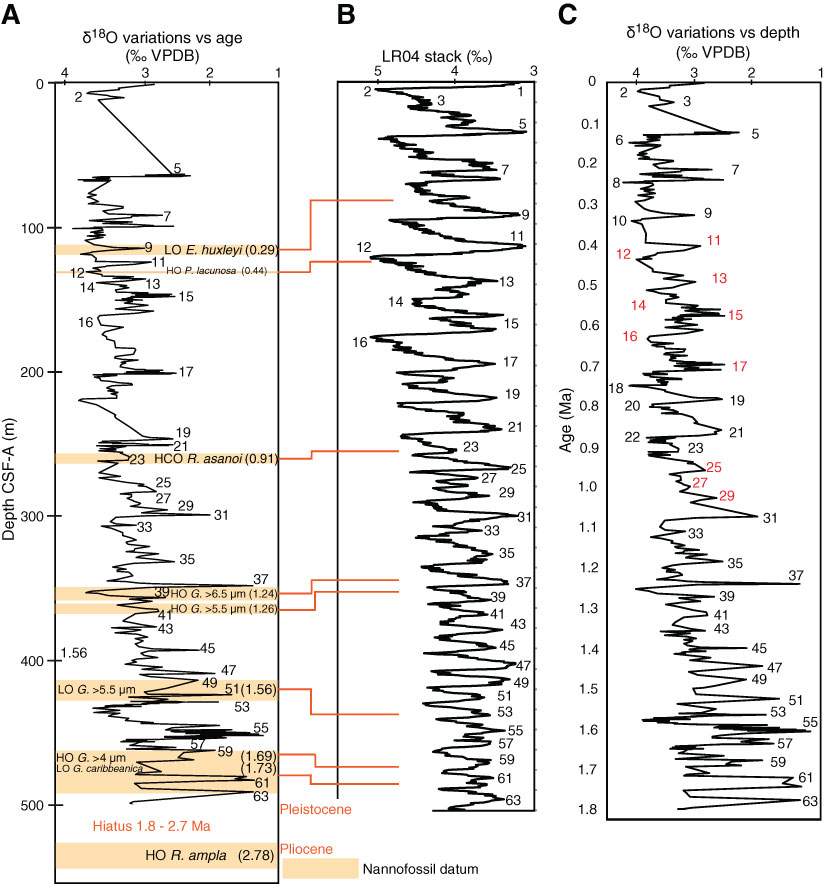
Figure F5. Oxygen isotope variations and LR04 stack (Lisiecki and Raymo, 2005), Site U1352. Numbers adjacent to data curves are marine isotope stages. A. 0–502 m CSF-A. Orange bars and lines = nannofossil datum ages (see Table T4). LO = lowest occurrence, HO = highest occurrence, HCO = highest common occurrence. Numbers in parentheses are ages (Ma). B. LR04 stack. C. Rescaled oxygen isotope variations (AnalySeries 2.0.4.3 software; Paillard et al., 1996) versus age. Red MIS numbers = correlations that are new and differ from those of Hoyanagi et al. (2014).
Previous | Close | Next | Top of page