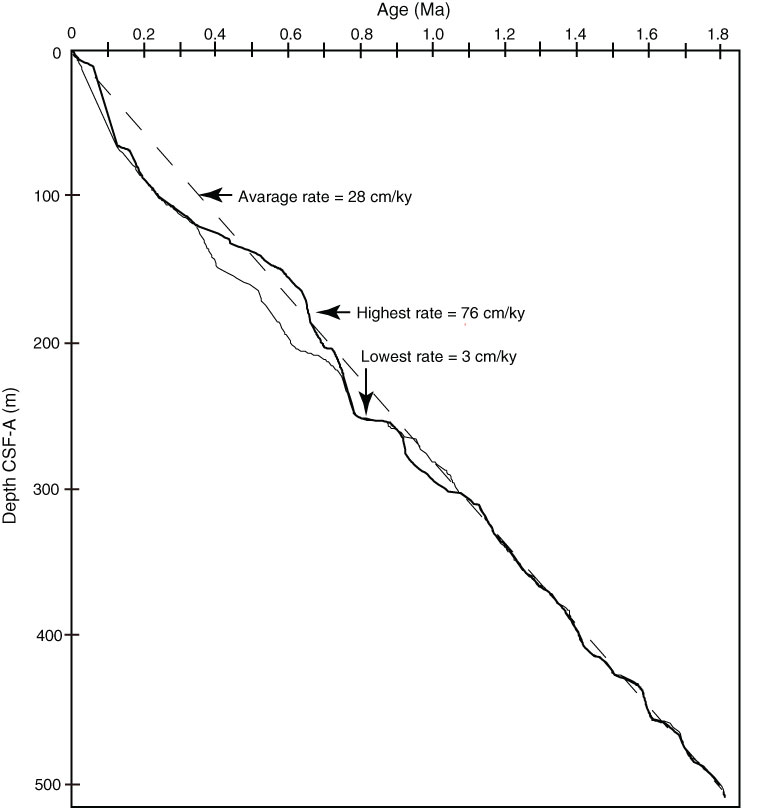
Figure F6. Sedimentation rates, Hole U1352B. Thick line = data produced using AnalySeries 2.0.4.3 software (Paillard et al., 1996), thin line = data from Hoyanagi et al. (2014), dotted line = average sedimentation rate for upper 500 m CSF-A.
Previous | Close | Top of page