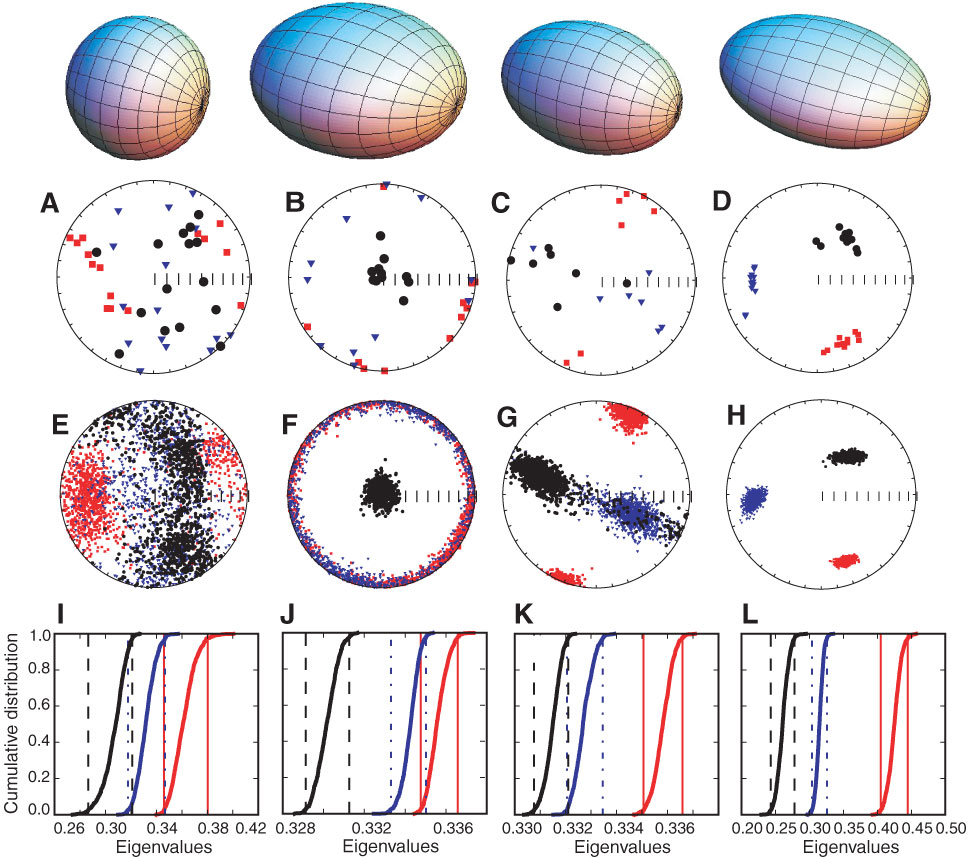
Figure F15. Interpretation of the shape of AMS data. Top balloons illustrate isotropic, oblate, prolate, and triaxial ellipsoids from left to right. A–D. Selected data sets plotted as eigenvector directions on equal-area projections from individual samples. Squares = directions associated with maximum eigenvalues, triangles = directions associated with intermediate eigenvalues, circles = directions associated with minimum eigenvalues. E–H. Bootstrapped eigenvectors from A–D, respectively. I–L. Cumulative distributions of the bootstrapped eigenvalues associated with the eigenvectors plotted in E–H. Bounds containing 95% of each eigenvalue: blue dash-dot lines = minimum eigenvector τ3, black dashed lines = intermediate τ2, solid red lines = maximum τ1. Figure from Tauxe (2010).
Previous | Close | Next | Top of page