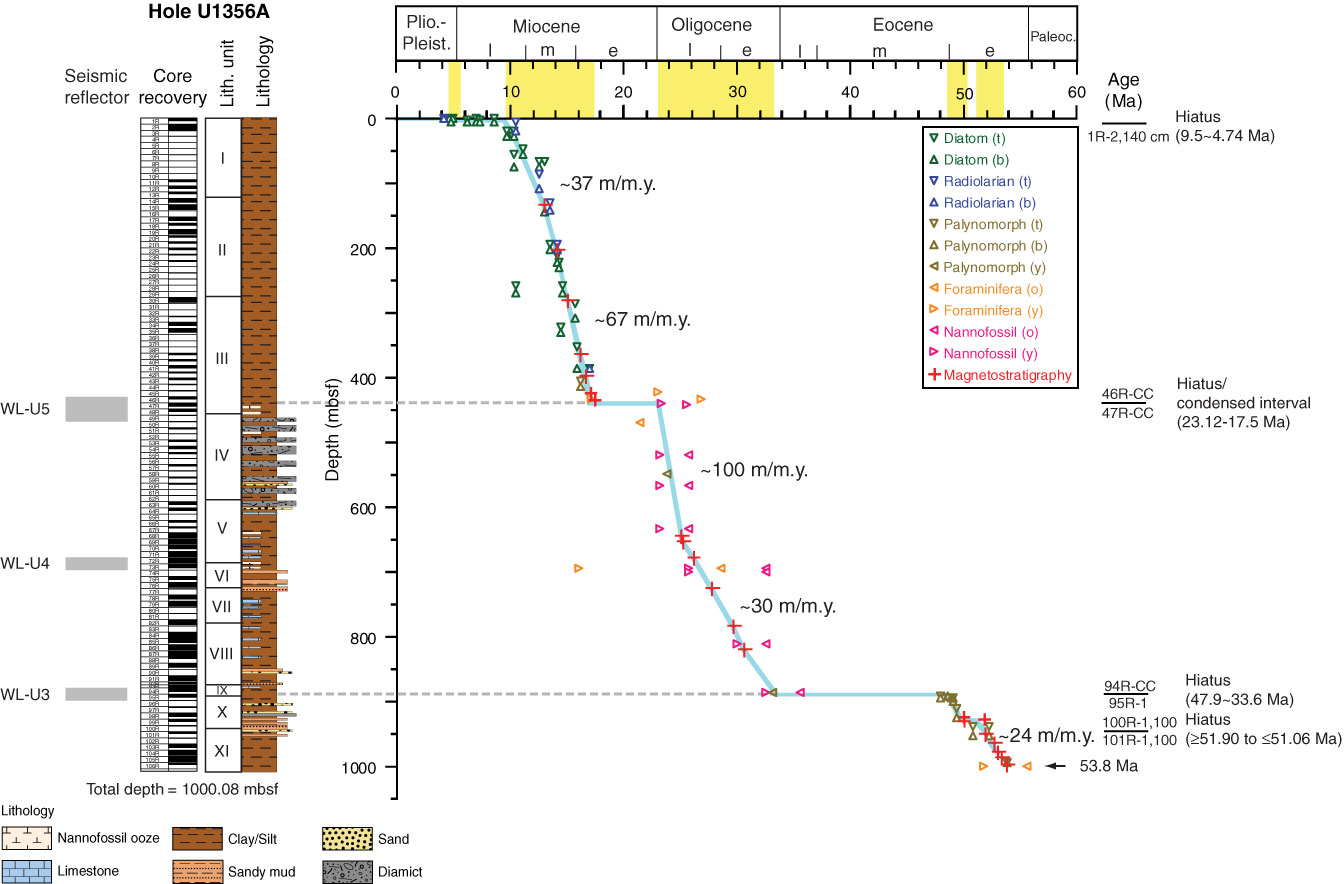
Figure F4. Biomagnetostratigraphic age-depth plot, Hole U1356A. Yellow shading = chronostratigraphic preservation. Microfossil datums are plotted by using the median depth between upper and lower samples (Table T9). Extra information derived from “shipboard” calcareous nannofossil information shown in Table T5 is also plotted. Mid-point absolute age in the average range model of Cody et al. (2008) is used for the diatom datums. t = top, b = bottom, o = oldest, y = youngest. Solid blue line = best-fit sedimentation rate. The base of Hole U1356A is ~53.8 Ma based on magnetostratigraphic data.
Previous | Close | Next | Top of page